US100, aiming for a new all-time high before the week's close
Zones of Supply (Sell): 21,950 and 22,000
Zones of Demand (Buy): 21,699.10 and 21,742.62
Technical Analysis
US100 (Nasdaq100), H1
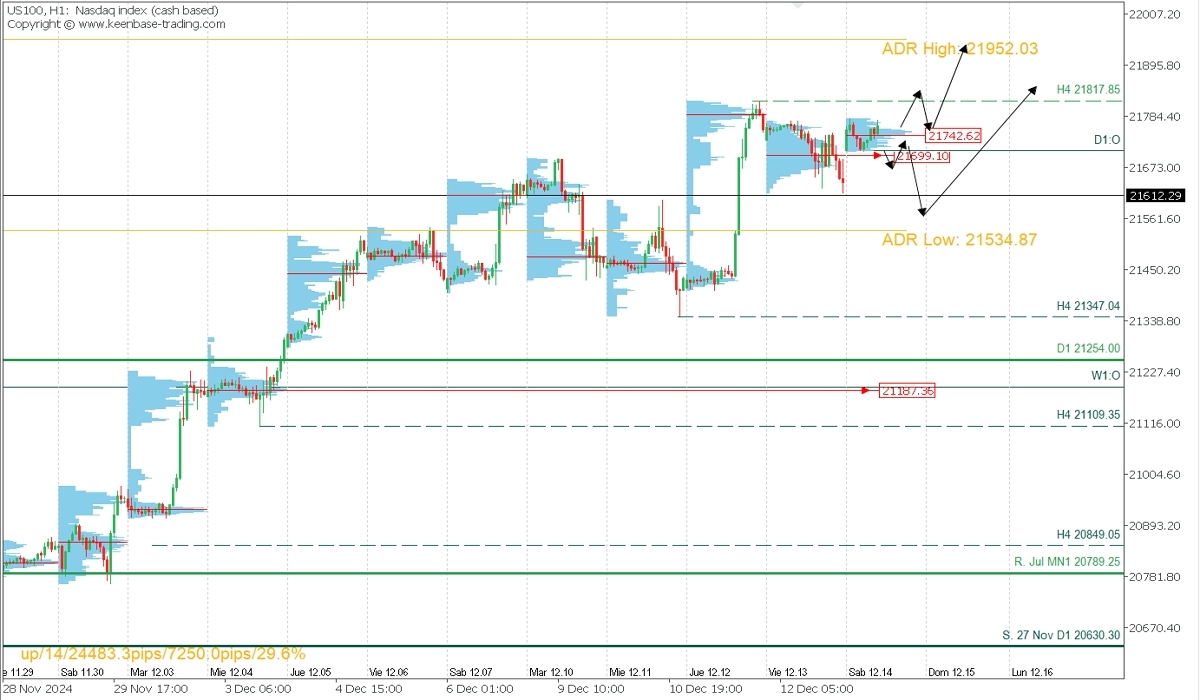
It reached a new all-time high on Wednesday, December 11, followed by a moderate correction to the weekly open at 21,612.29. A renewed bullish bias is now evident, with Friday’s session opening with a bullish gap and trading above Thursday’s volume concentration at 21,699.10. Additionally, volume clustering near 21,742.62 suggests a potential rally aiming to break the local resistance and current all-time high at 21,817.85, extending toward the average bullish range at 21,952.03.
This bullish scenario has a strong likelihood of remaining valid in the coming days, supported by the last confirmed support at the Tuesday, December 10 level of 21,347.
Fundamental Analysis
The Nasdaq 100 has shown volatility this week, retreating 0.7% on Thursday following Wednesday’s optimism, when it surpassed 21,800 points for the first time. Thursday’s performance reflected declines in large-cap tech stocks such as Nvidia, Alphabet, Amazon, and Tesla, although Apple and Microsoft posted slight gains. Additionally, Broadcom fell 1.4% ahead of its quarterly earnings report, and Adobe led declines with a 14% drop due to a revenue outlook below expectations, despite strong prior financial results. This pullback was also influenced by economic data showing higher-than-expected producer price inflation and a rise in unemployment claims, indicating persistent inflationary pressures. Despite this, markets still anticipate a high likelihood of a Federal Reserve rate cut in its next meeting, although slow inflation progress could limit further cuts. This dynamic puts pressure on tech stock valuations, which tend to perform well under expectations of looser monetary policy.
Technical Analysis
US100 (Nasdaq100), H1

- Supply Zones (Sell): 21,950 and 22,000
- Demand Zones (Buy): 21,699.10 and 21,742.62
It reached a new all-time high on Wednesday, December 11, followed by a moderate correction to the weekly open at 21,612.29. A renewed bullish bias is now evident, with Friday’s session opening with a bullish gap and trading above Thursday’s volume concentration at 21,699.10. Additionally, volume clustering near 21,742.62 suggests a potential rally aiming to break the local resistance and current all-time high at 21,817.85, extending toward the average bullish range at 21,952.03.
This bullish scenario has a strong likelihood of remaining valid in the coming days, supported by the last confirmed support at the Tuesday, December 10 level of 21,347.
Technical Summary
- Bullish Scenario: Buy after confirmed breakout of the 21,817.85 resistance, with intraday TP at 21,950/52 and an extension to 22,000 in the coming days.
- Corrective Bearish Scenario: Sell below 21,699 with TP at 21,612 and 21,550, from where new buying opportunities can be considered.
Always wait for the formation and confirmation of an *Exhaustion/Reversal Pattern (ERP) on M5, as taught here: https://t.me/spanishfbs/2258, before entering a trade at the key levels mentioned.
Additional Notes
Uncovered POC (Point of Control): POC is the level or zone with the highest volume concentration. If previously followed by a bearish move, it is considered a sell zone forming resistance. Conversely, if previously followed by a bullish impulse, it is considered a buy zone, typically located at lows, forming support levels.
@2x.png?quality=90)


