UK wages have risen faster than expected, while the unemployment rate remains at 4.3%. This strong wage data has led investors to reduce their bets on interest rate cuts by the Bank of England in 2025, pushing government bond yields (gilt yields) higher. The FTSE 100, a key UK stock market index, is under pressure, falling to its lowest level in about three weeks with widespread declines across companies.
Bloomberg’s analysis shows that rising payroll taxes will hit retail, hospitality, and high street companies hardest, costing Asda and Sainsbury’s hundreds of millions of pounds. Overall, the increased tax burden for 73 companies is expected to reach £1.5 billion, with the rest of the FTSE 100 contributing far less.
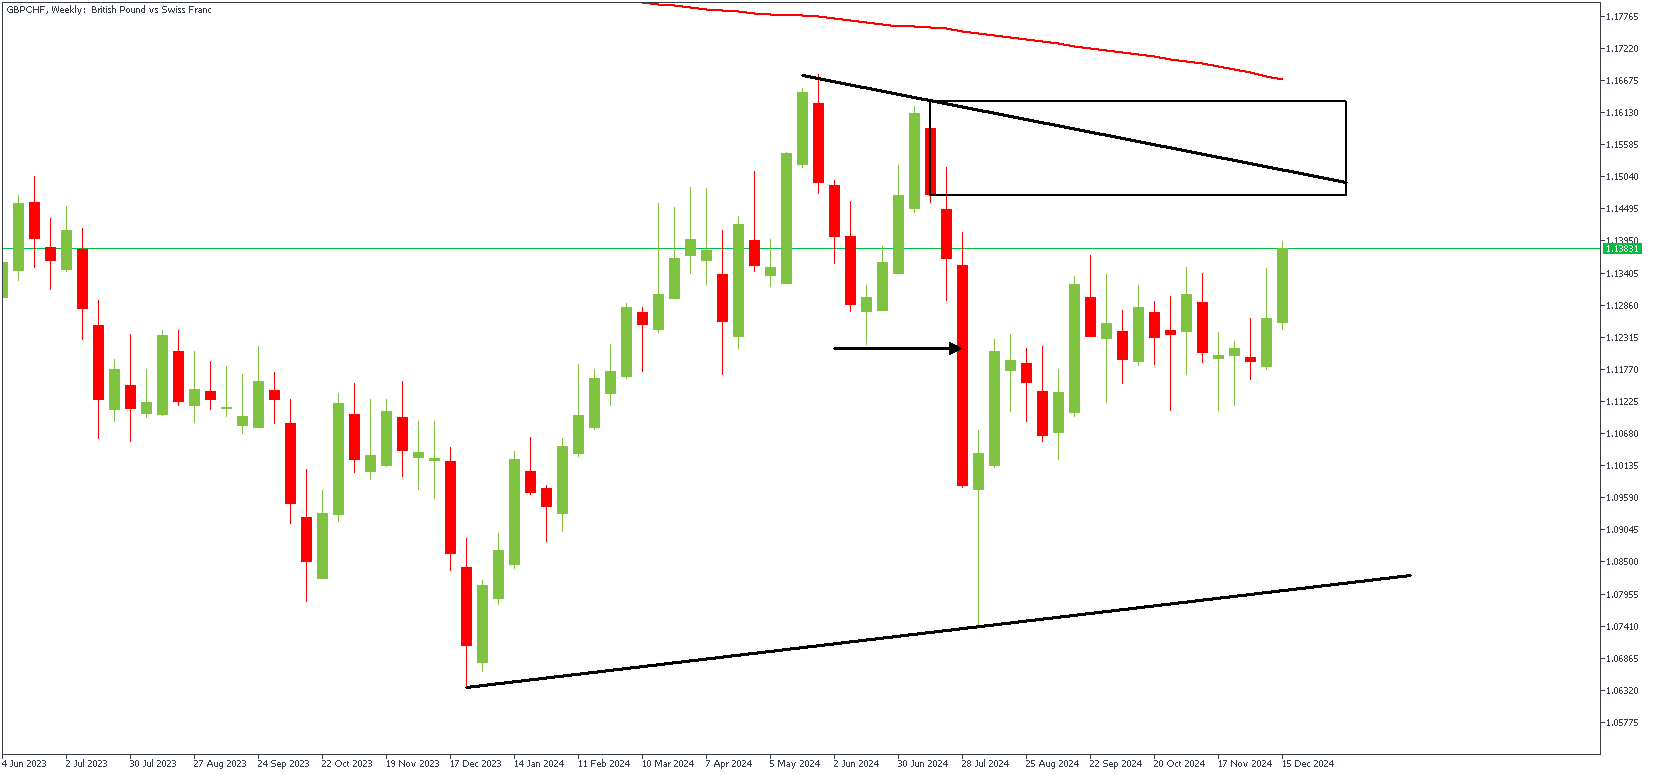
GBPCHF – W1 Timeframe

There’s been a bearish break of structure on the weekly timeframe chart of GBPCHF. The price is currently approaching the supply zone and the resistance trendline while trading within the wedge pattern. This sets the sentiment as bearish—pending confirmation from the lower timeframe.
GBPCHF – D1 Timeframe
.png)
The price action on the daily timeframe chart of GBPCHF is slightly easier to read. Here, we see the price approaching the 88% Fibonacci retracement level, which is in confluence with the resistance trendline and the rally-base-drop supply zone. However, due diligence is required before executing any trades in this regard.
Analyst’s Expectations:
Direction: Bearish
Target: 1.10259
Invalidation: 1.16723
CONCLUSION
You can access more trade ideas and prompt market updates on the telegram channel.


