Fundamental Analysis
WTI crude oil prices have started to recover, trading at $68.90 amidst rising tensions ahead of the key OPEC+ meeting on Thursday. A critical article by a senior Iranian official has highlighted that the group’s production cut policies have kept prices elevated for too long, incentivizing cheaper oil production outside the cartel, particularly in the U.S. This debate could stir internal frictions within OPEC+ and increase uncertainty regarding policy decisions for 2025.
Additionally, the strengthening U.S. Dollar Index (DXY), driven by Trump’s threats against BRICS and the political turmoil in France, adds bearish pressure on crude, as a stronger dollar typically makes commodities more expensive. While the partial shutdown of the Druzhba pipeline in Poland could temporarily support prices, the short-term outlook will depend on whether OPEC+ manages to send clear signals about supply adjustments to stabilize prices in an increasingly competitive global market.
Technical Analysis
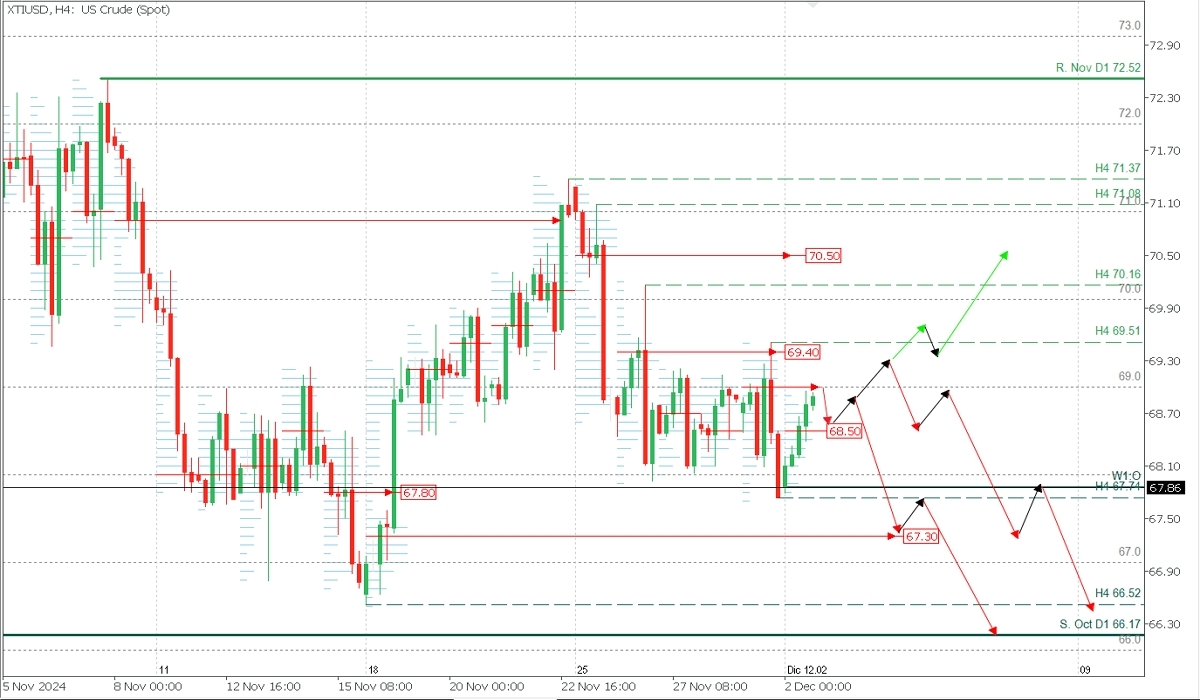
XTIUSD, H2

- Supply Zones (Sell Levels): 69.00 and 69.40
- Demand Zones (Buy Levels): 68.50, 67.30
Crude oil remains under bearish pressure, hitting the sell targets outlined in the previous analysis here.
The current support sits at 67.74, confirming 69.51 as the most recent validated resistance. This implies that the bearish trend will persist as long as the price remains below this level.
At the time of this analysis, the day's bullish opening drove the price toward Friday’s POC at 69.00, identified as the latest supply zone. New short positions are expected below this zone, targeting Friday's support at 67.74 and the next demand zone around 67.30 intraday.
If a bounce occurs, followed by a break of the indicated demand zone, the price will aim for October's support at 66.17 and the psychological level of 66.00. This scenario will hold unless news emerges concerning risks to crude transportation.
Technical Summary
Bearish Scenario:
- Sell Below 69.00
- Take Profits (TP): 68.50, 68.00, 67.74, 67.30 (intraday), and 67.00, 66.52, 66.17, 66.00 (throughout the week).
- As long as the price does not break above the latest validated resistance, currently at 69.51, which will shift lower as the price declines.
Bullish Scenario:
- Buy Above 69.51
- Take Profits (TP): 70.00 and 70.50 (extension).
- Use a stop-loss (SL) of 1% of your capital with a small lot size to allow for market fluctuations.
Always wait for the formation and confirmation of an Exhaustion/Reversal Pattern (ERP) on the M5 timeframe, as taught here, before entering any trade at the key levels indicated.
@2x.png?quality=90)

