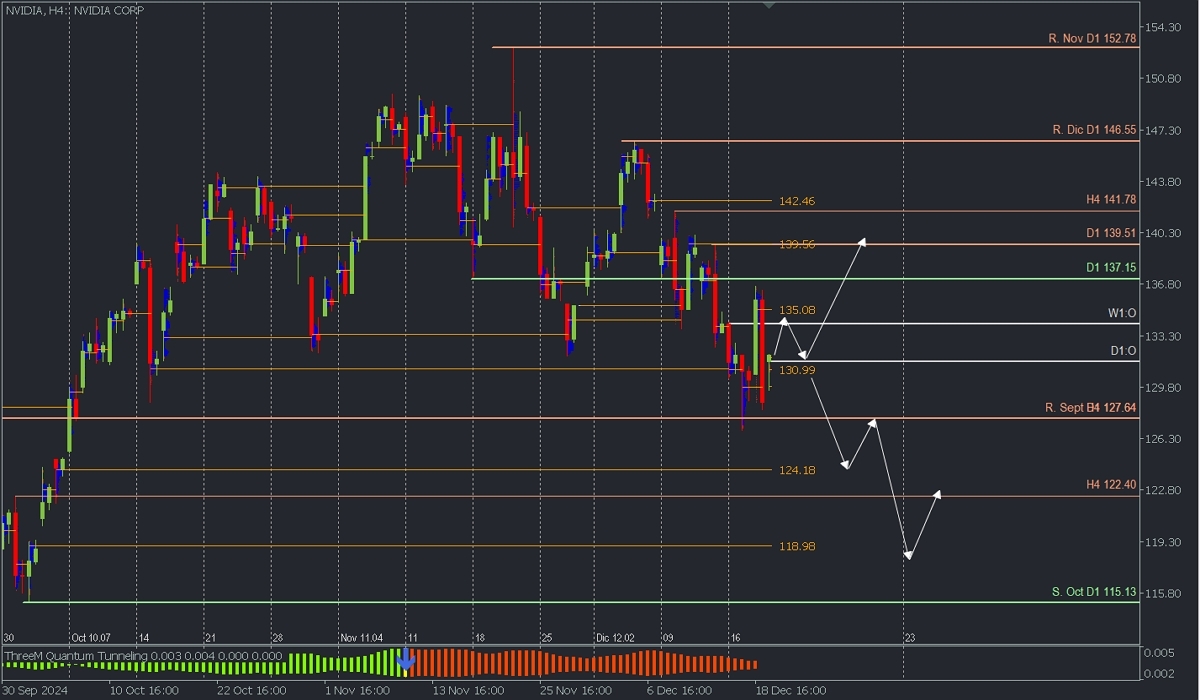
Nvidia closed on December 18 at $128.91, marking a decline of approximately 12% from its all-time high of $148.88 recorded on November 7. However, pre-market prices today suggested a recovery of 2.13%, which has already started to fade, positioning the opening price at $131.65. This slight rebound may reflect optimism fueled by analysts’ projections, who remain bullish despite the correction.
The 10% technical correction, partially driven by the recent antitrust investigation in China, has not altered long-term perspectives. Bank of America and Bernstein have reiterated Nvidia as their "top pick," with price targets of $190 and $175, respectively. Furthermore, Bernstein anticipates a solid 2025 for the company, supported by its transition from Hopper to Blackwell chips, which could be pivotal for its future performance.
Monitoring whether the current pre-market levels act as support will be crucial, along with assessing whether the bullish projections generate enough momentum to resume an upward trend—especially given Nvidia's outstanding performance in 2024 (+165%).
Technical Analysis
Nvidia, H4

- Supply Zones (Sell): 135.08, 139.56 y 142.46
- Demand Zones (Buy): 130.99, 124.18 y 118.98
Nvidia has entered a macro correction, triggering an intraday and daily trend reversal after breaking the confirmed support at 137.15 on November 18. Following today’s opening gap, the price might retrace towards the supply zone around 135.08. A breakout above this level could renew buying interest towards the intraday validated resistance at 139.51, which aligns with a key uncovered Point of Control (POC) and supply zone. Once breached, the bullish trend could extend towards the next supply zone near 142.46.
Conversely, if bears defend the supply zone at 135.08 and the price breaks the demand zone around 130.99, Nvidia's stock could continue falling, targeting the next demand zones around 124.18 and 118.98 in the coming days.
Technical Summary
- Bullish Scenario: Buy positions above 131.00 (after forming and confirming an Exhaustion/Reversal Pattern (ERP) in M5) with targets at 135.00, 137.15, and 139.50 as extensions.
- Bearish Scenario: Sell positions below 130.00 with targets at 127.64, 124.18, 122.40, and 119.00.
Always wait for the formation and confirmation of an Exhaustion/Reversal Pattern (ERP) in M5 as taught here before entering trades at the key levels mentioned above.
Key Notes:
- Uncovered POC: A POC (Point of Control) is the price level where the highest volume concentration occurred. If a downward movement followed this level, it is considered a sell zone, forming resistance. Conversely, if an upward movement followed, it is considered a buy zone, typically forming support.
@2x.png?quality=90)


