Fundamental Analysis
The Dow Jones has recently exhibited divergent behaviour compared to the Nasdaq and S&P 500, driven by differences in sector composition and economic expectations. Declines in traditional components like UnitedHealth and other health and energy-related stocks have dragged down the Dow Jones. Additionally, the index's composition, more defensive and less tech-exposed, has limited its ability to follow the momentum of the other indices. This highlights a market rotation towards growth stocks fueled by optimism over potential Fed rate cuts, while lower-growth sectors face specific economic challenges.
Technical Analysis
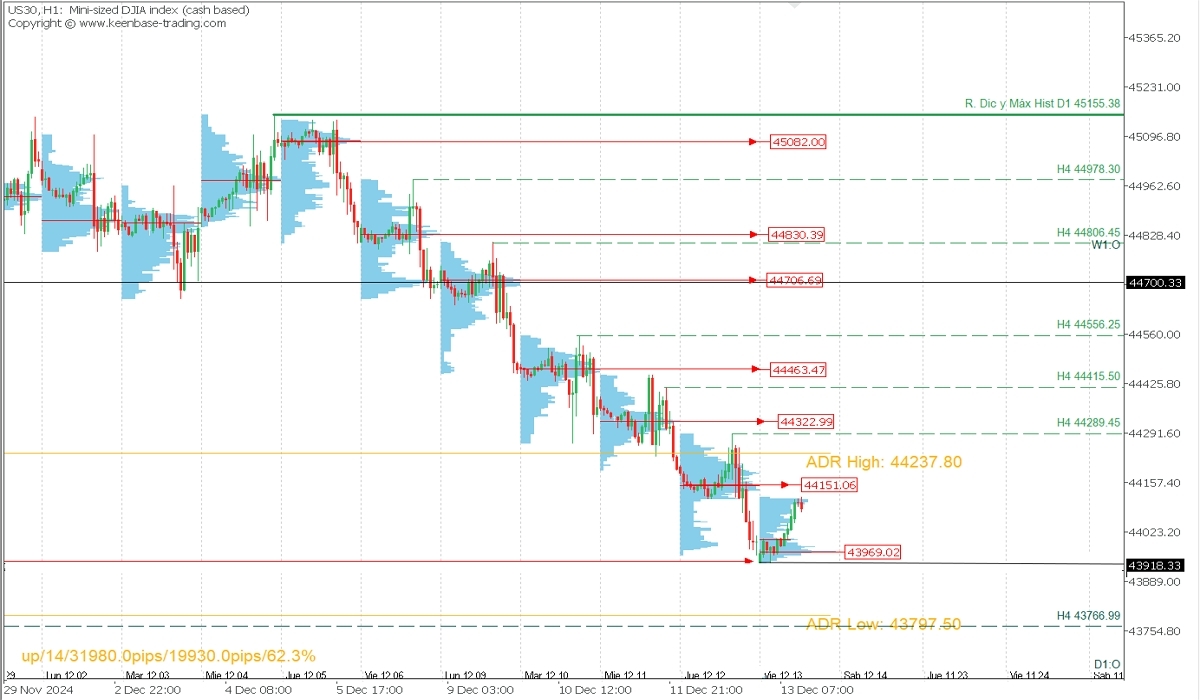
US30 (Dow Jones), H1

- Supply Zones (Sell): 44151, 44323, and 44463.47
- Demand Zones (Buy): 43969.02 and 43794
The index has been in a prolonged bearish correction after forming a double top at the November-December resistance, with its latest all-time high on December 4 at 45155.38.
Currently, the price opened bullishly (OD:1) at 43918.33, having reached a demand zone around 43943 and forming a new concentration near 43969.02. This has driven buying during the early sessions towards yesterday’s uncovered POC* at 44151.06, the nearest supply zone. From this point, a further decline towards the support and daily opening level at 43918.33 is expected, with an extension to the 43494.31 level, close to the average bearish range.
This scenario will remain valid as long as the last intraday validated resistance at 44289.45 is not decisively broken.
Technical Summary
- Bearish Scenario: Sell positions below 44151 (after forming and confirming a PAR*) with an intraday TP at 43970. A decisive break below this level could extend the target to 43794 in the coming days.
- This bearish scenario will be invalidated if the current rally decisively breaks above the 44289.45 resistance, in which case bullish reversal buy opportunities may be considered.
Always wait for the formation and confirmation of an *Exhaustion/Reversal Pattern (PAR) on M5, as explained here: https://t.me/spanishfbs/2258, before entering trades in the key zones indicated.
*Uncovered POC: POC = Point of Control. The level or zone with the highest volume concentration. If a bearish move followed this level, it is considered a selling zone and forms resistance. Conversely, if it was followed by a bullish move, it is a buying zone, usually located at lows and forming support areas.
@2x.png?quality=90)

