ICT Trading Strategy — Key Techniques for Mastering Forex
Sept 4, 2024
Strategy
ICT Trading Strategy — Key Techniques for Mastering Forex
A comprehensive guide to leveraging Inner Circle Trader strategy in trading.
What is the ICT Trading Strategy?
Basic principles and objectives of the ICT trading strategy
The ICT strategy is a trading strategy developed by Michael J. Huddleston. A sophisticated approach to forex trading that models the behavior of large institutional players (institutions) on the market, it enables retail traders to anticipate market movements by understanding and mimicking the strategies used by institutions. This method is built on a deep understanding of market structure, order flow, and price action.
Key components of the ICT trading strategy
The ICT strategy includes a number of components that are essential for identifying potential trade setups and predicting market behavior. These collectively represent several frameworks for traders, including order blocks, fair value gaps, liquidity pools, and much more.
A brief overview of trading strategies and their significance
Introduction to the ICT trading strategy
This trading strategy presents an essential function, providing traders with a system for making trading decisions. The ICT trading strategy is particularly notable for its detailed analysis, which helps traders navigate complex financial markets. Traders who master this strategy can gain a significant advantage over their competition.
Understanding the ICT trading strategy
The ICT trading strategy includes several key concepts: market structure, optimal trade entry points, and the significance of various trading sessions. Understanding these concepts is necessary for applying the methodology effectively. They improve the trader’s ability to predict market movements and understand their roots.
A detailed description of the key components
Fair value gap
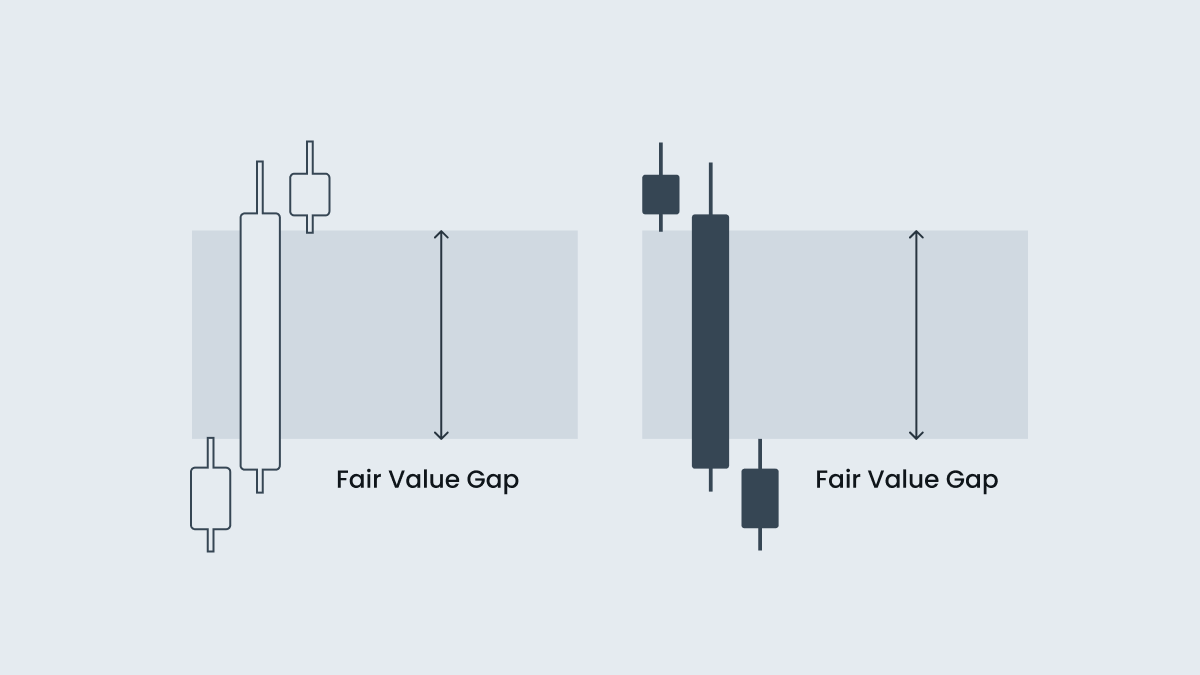
The fair value gap (FVG), also known as imbalance, is a concept that is critical to the ICT forex trading strategy. It refers to a price gap created by an imbalance in buying or selling, often leading to a robust price movement away from its fair value. These gaps typically get filled as the market seeks a balance, providing traders with potential entry and exit points.
FVG is usually presented as a three-candlestick pattern on the price chart. In a bullish scenario:
The upper wick of the first candle does not connect to the lower wick of the third candle.
The gap (on the second candle) created by the wicks of the first and third candles is called the fair value gap.
In a bearish scenario, the pattern is reversed, with the lower wick of the first candle not connecting to the upper wick of the third candle.
The market tries to fill this imbalance zone (FGV), acting like a magnet for the price. By recognizing these gaps, traders can anticipate potential price reactions and plan their entries and exits.
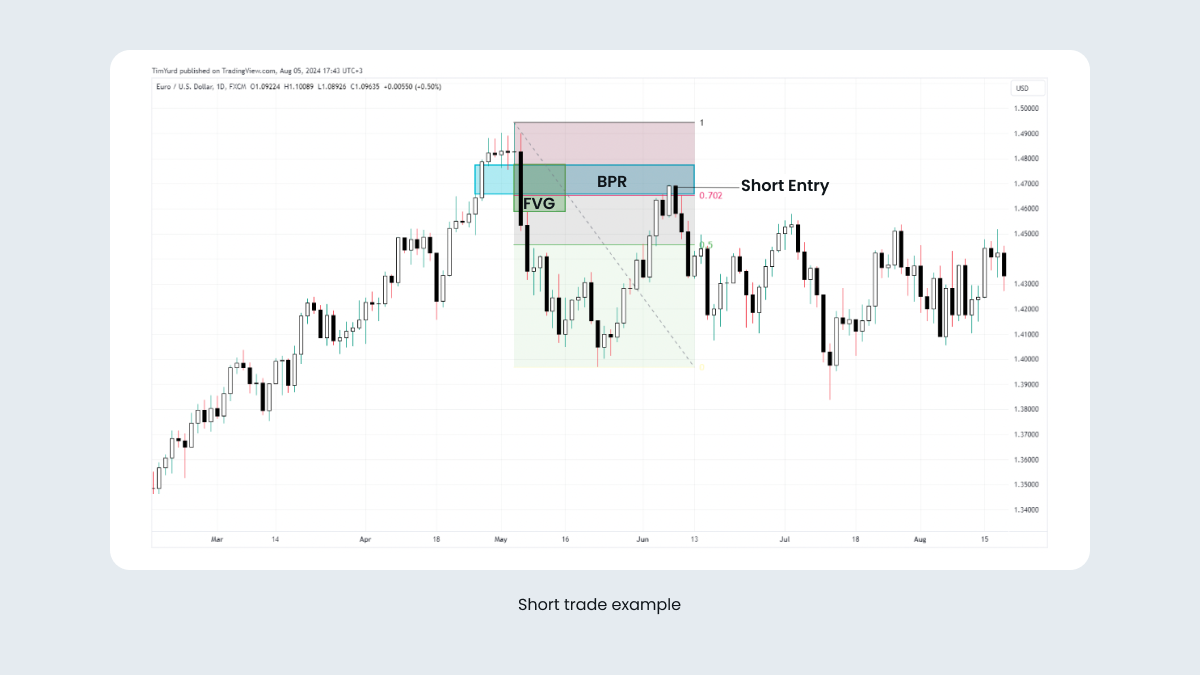
To enter a short trade, wait for the price to sweep the closest liquidity pool and reverse, leaving the FVG behind, as shown in the chart above.
Optimal trade entry is another crucial component of the ICT strategy. This concept involves identifying the balanced price range — a zone that the market will retest before resuming its trend.
These levels are significant in that they matter to the institutional participants. For example, the price impulsing at a given level suggests that a large trade was executed, or significant stop-losses were triggered. Prices often return to these impulse points, which makes them optimal entry points.
Another way to understand the optimal trade entry (OTE) is based on the fact that, during an uptrend, traders prefer to trade from the long side. To do this effectively, they look for a correction in the uptrend that is deep enough to offer an optimal risk-reward ratio, but not so deep that it breaks the trend. These corrections, often called OTEs, typically align with imbalances, order blocks, or retracements below the 0.618 Fibonacci level, ensuring optimal entry by capitalizing on the natural pullback and maintaining trend power.
To identify the balanced price range (BPR) zone, you have to mark a fair value gap on the sell side of the price and another one on the buy side (or opposite in the reverse situation).
These fair value gaps are horizontally aligned with each other.
Now find and mark the price area where both fair value gaps overlap.
In a case like this, the value 0.702 Fibo will help you open trades with a better risk/profit ratio.
In the example above, you can see how the price reverses downwards when the BPR zone at 0.702 Fibonacci is reached.
Order blocks
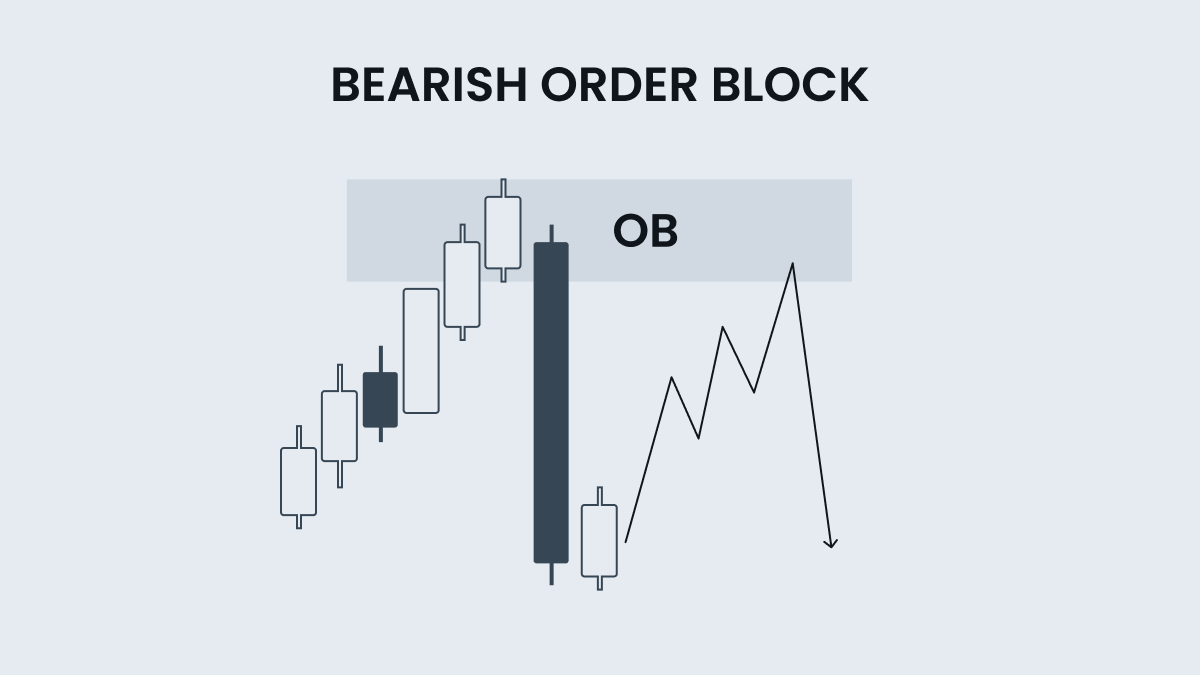
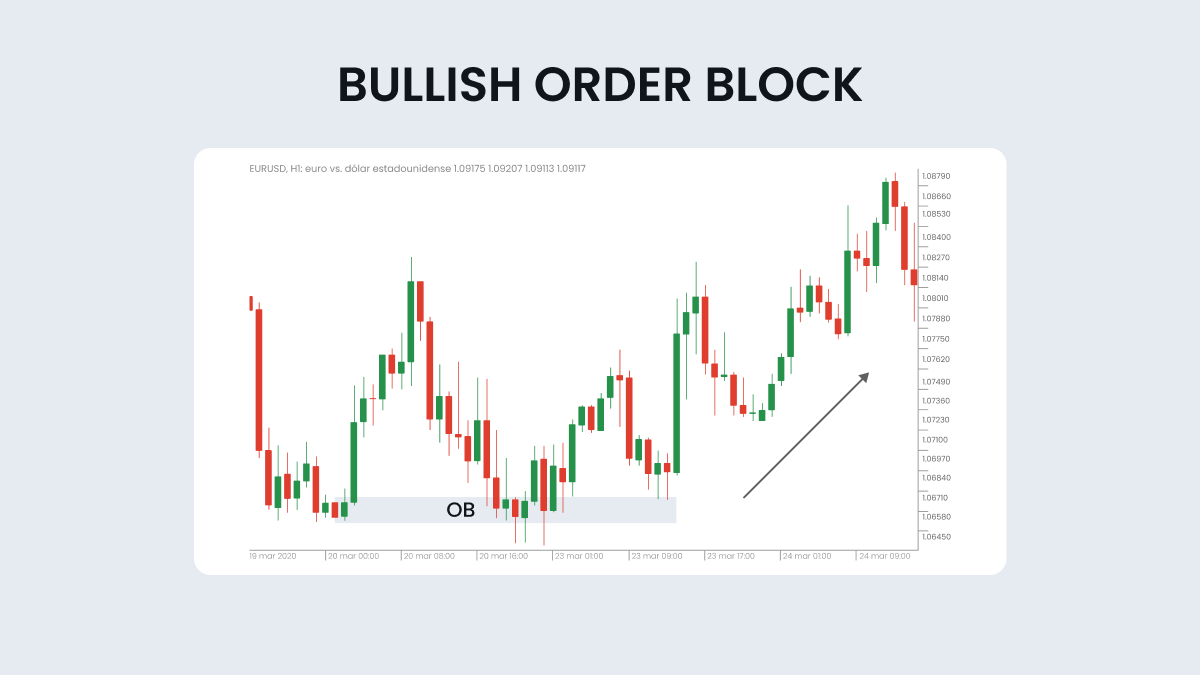
Order blocks are supply and demand zones where institutional market participants and retail traders place large orders. Since a large order can cause a robust price change, it is broken down into smaller order blocks executed as counter orders accumulate liquidity. These steps allow institutional traders to fully execute a large order without significantly affecting the price.
The bearish OB often resembles the last bullish candle before a decline, or a bearish candle before a rise in the opposite situation.
When identifying order blocks, the senior timeframe is a crucial aspect to include in the chart. For example, a daily order block (OB) is much more significant than a 4-hour OB. Higher timeframe order blocks generally have a stronger influence and retracement on price action and are more reliable for making trading decisions.
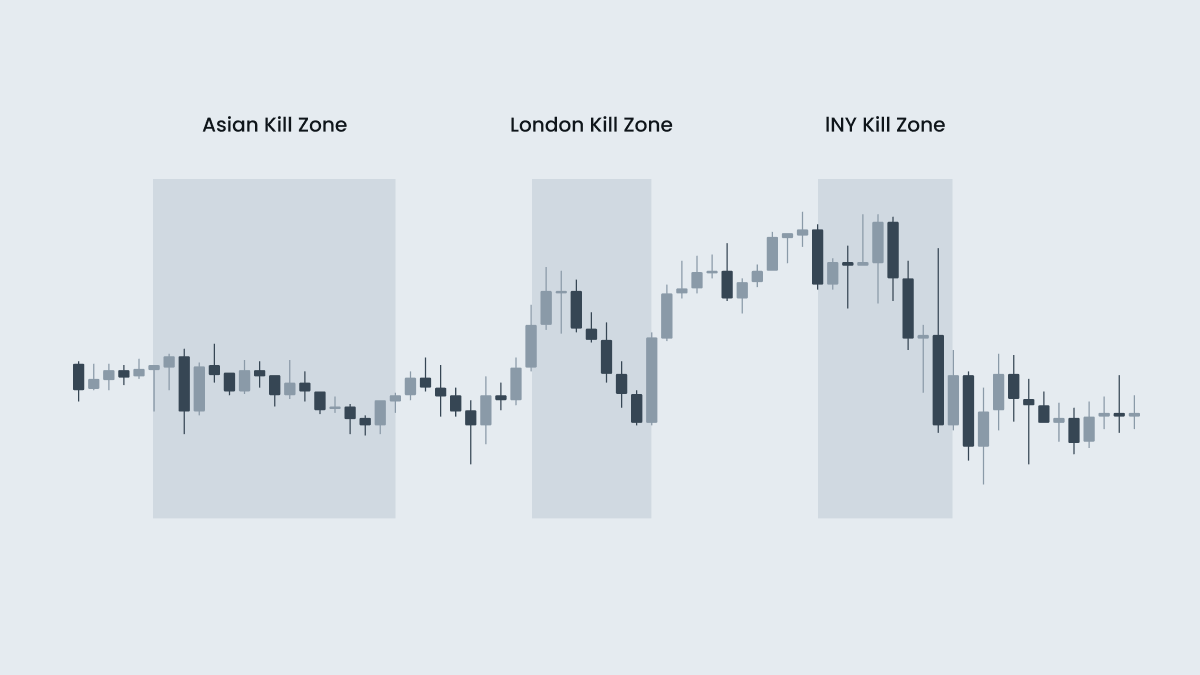
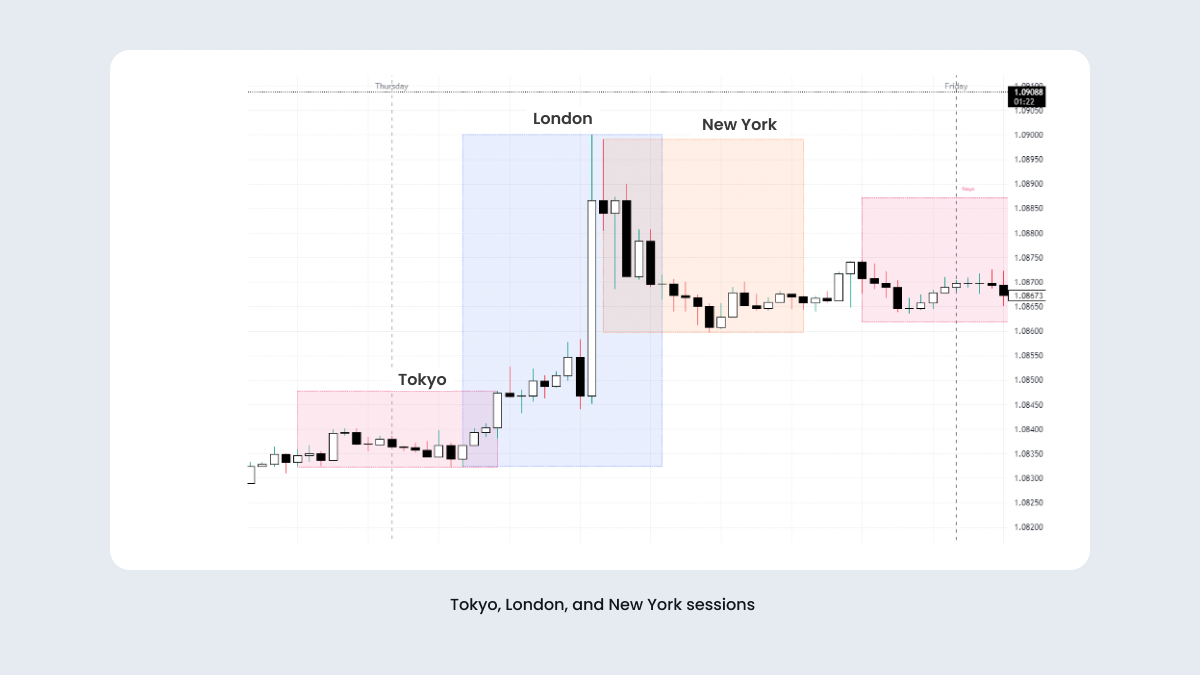
Kill zones represent a specific time period of the day when the market is especially likely to demonstrate certain predictable movements. These periods include the Asian Session, the London Open, and the New York Open.
Asian session range
The Asian session range, from 3:00 a.m. to 12:00 p.m. (GMT+3), is a very specific period in the ICT strategy because it often shows a market consolidation, which sets up potential trade opportunities for the more volatile London and New York sessions.
On the higher timeframes, you can use the ICT Asian range to forecast price action following the session. A tight consolidation within the Asian range typically signals an upcoming trend shift where the market will likely sweep out liquidity either above or below this range. This liquidity sweep traps retail traders into trading in the wrong direction, after which the price often reverses.
London Open momentum
The London Open is well known for its high rising volatility and significant price movements, especially during the London opening kill zone from 09:00 a.m. to 12:00 p.m. (GMT +3). This period is good for trading EUR and GBP currency pairs, giving a potentially great opportunity for high profitability.
The London session has the biggest potential for substantial directional movement. If the daily trend is upward, traders can use this session to identify the trading day's low and high. Typically, the high or low of the day forms during the London session, making it a critical period for executing trades based on the overall daily trend.
New York session volume profile
The New York kill zone, from 1:00 p.m. to 4:00 p.m GMT in winter and from 12:00 p.m. to 3:00 p.m. GMT in summer, is crucial for USD-paired currencies and almost all the markets. This window marks the overlap of the London and New York sessions, resulting in heightened volatility due to the simultaneous activity of traders from both continents.
During this time, traders seek either the continuation, or the reversal of trends established in the London and Asian sessions.
Risks and limitations of the ICT trading strategy
To successfully implement the ICT strategy, traders must wait for clear setups and strictly adhere to the risk management rules.
The complexity of the ICT strategy requires a deep understanding of price movements, liquidity pools, and institutional player behavior.
The success of the ICT strategy hinges on the trader’s ability to interpret market signals and execute trades effectively and accurately. Even if you follow the strategy’s guidelines, misinterpretation or poor execution can result in losses.
Potential disadvantages or challenges of using ICT
One of the main challenges of the ICT strategy is its complexity. The strategy encompasses numerous concepts and requires a deep understanding of market dynamics. Additionally, the strategy may not be suitable for all traders, particularly those with limited experience or time to dedicate to learning the methodology.
Tips for mitigating risks and maximizing benefits
To effectively mitigate risks and maximize benefits with the ICT trading strategy, it is essential to correctly identify the setups on the higher and smaller timeframes and trade by their trends. Аligning with the trends increases the likelihood of a successful trade. Equally important, ensure your risk-reward ratio is balanced with your profitability for good risk management. For example, a strategy with a 50% profitability rate and a risk-reward ratio of 1:2 can be effectively combined to form a successful trading approach.
It is important to understand that smart money concepts are not guarantees of success, but principles that require thorough backtesting and profound understanding. Backtesting your strategy is essential for establishing realistic expectations, and it helps you finetune your strategy. Have peace of mind, knowing your approach is based on tested methods rather than theoretical assumptions.
Exploration of the ICT trading strategy requires a deep understanding of its key components and the roots of market movements. By focusing on fair value gaps, optimal trade entry points, and the dynamics of various trading sessions, traders can improve their ability to predict market movements and institutional trader behavior. While the strategy is complex and comes with risks, proper education and practice can help traders leverage its benefits for successful trading.
FAQ
Is ICT a good trading strategy?
The ICT trading model is quite successful among many traders for its structured approach to market analysis. It emphasizes understanding market behavior, institutional order flow, and key price levels. However, its complexity means it may not be suitable for all traders, especially beginners who might initially find it overwhelming.
What is the ICT silver bullet strategy?
The ICT silver bullet strategy is an intraday trading approach that focuses on capturing significant price moves within a short time frame. It involves identifying key liquidity points and trading during specific times of the day when the market is more likely to exhibit predictable movements. The strategy aims to capitalize on rapid price changes and is designed to work in highly liquid market conditions.
What is the ICT market structure?
The ICT market structure is a framework used to understand and analyze the overall direction and behavior of the market. It involves identifying key phases such as accumulation, manipulation, and distribution, and recognizing shifts in market trends. These shifts are indicated by breaks in significant price levels, which can signal potential trade opportunities. Understanding market structure is crucial for implementing the ICT trading strategy effectively.
What is the ICT trading strategy?
The ICT (Inner Circle Trader) strategy encompasses various techniques and principles for improving trading performance by leveraging the behavior and tactics of institutional traders. It involves understanding ICT market structure, order flow, and key trading sessions.