FBS is excited to share that we have increased leverage on indices to 1:500. This means you can make the most of the upcoming market volatility and supercharge your trading strategy.
Why is it essential to pay attention to the stock market?
There are several key factors hovering on the horizon, such as the September Effect, shifts in US monetary policy, and the US presidential race, that are likely to cause significant movements in the stock market. By understanding these influences, you can sharpen your trading strategy for this critical period. In the following article, we’ll explore each of these factors in detail.
September Effect
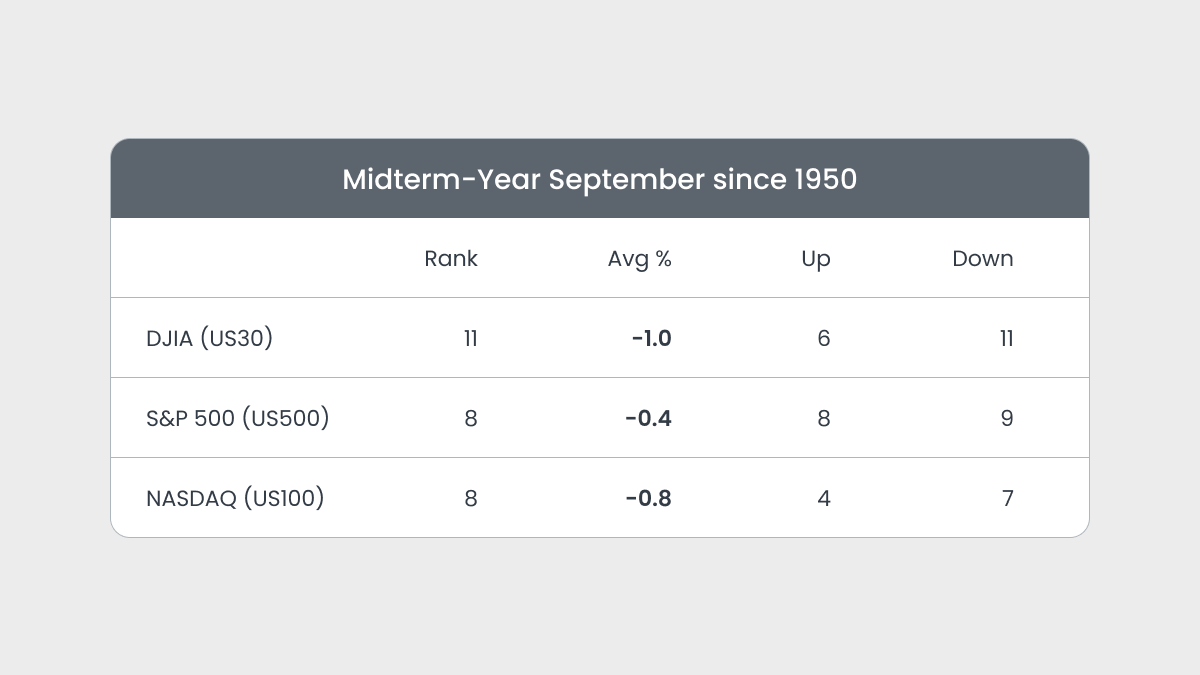
The September Effect refers to the historically weak stock market returns observed during September. On average, September has been the most volatile month for stock markets and the US500.
Since 1950, September has been the worst month for the US30, US100 and US500. September failed four years in a row from 1999 through 2002 after four stable years from 1995 through 1998 during the dot-com bubble frenzy.
However, it is worth noting that The September Effect is based more on long-term statistical data over 100 years than any theories or actual financial indicators. That’s why some investors don’t take this phenomenon very seriously and like to poke some fun at it.
There are various theories about the September Effect as well as much debate over its cause. Let’s explore different viewpoints on this phenomenon and dive into an in-depth analysis.
One of the most common explanations is that the September Effect is simply a seasonal trend. Historically, summer months tend to be slow for the market as investors take vacations and trading volume decreases. As fall approaches and people return to work, trading volume picks up again, eventually increasing volatility. To top it all off, many companies release their quarterly earnings reports in September, which can cause stock prices to fluctuate.
Another theory suggests that the September Effect is more about investor psychology than anything else. As summer ends, some people tend to get more anxious and depressed, which arguably can lead to negative sentiment about the market.
September is often filled with political uncertainty. In the US, it marks the end of the federal fiscal year, sparking budget and tax debates. Plus, many countries have fall elections, creating economic and market uncertainty.
Finally, some analysts link the September Effect to interest rate changes. The stock market can be impacted as central banks like the Federal Reserve adjust rates.
September’s volatility often leads to notable market movements, and with the increased leverage, you can better position yourself to benefit from these fluctuations.
NFP and FOMC Meeting
Last week’s FOMC meeting has already resulted in significant market volatility and the rise of the US500 due to Powel’s signal of upcoming rate cuts in September.
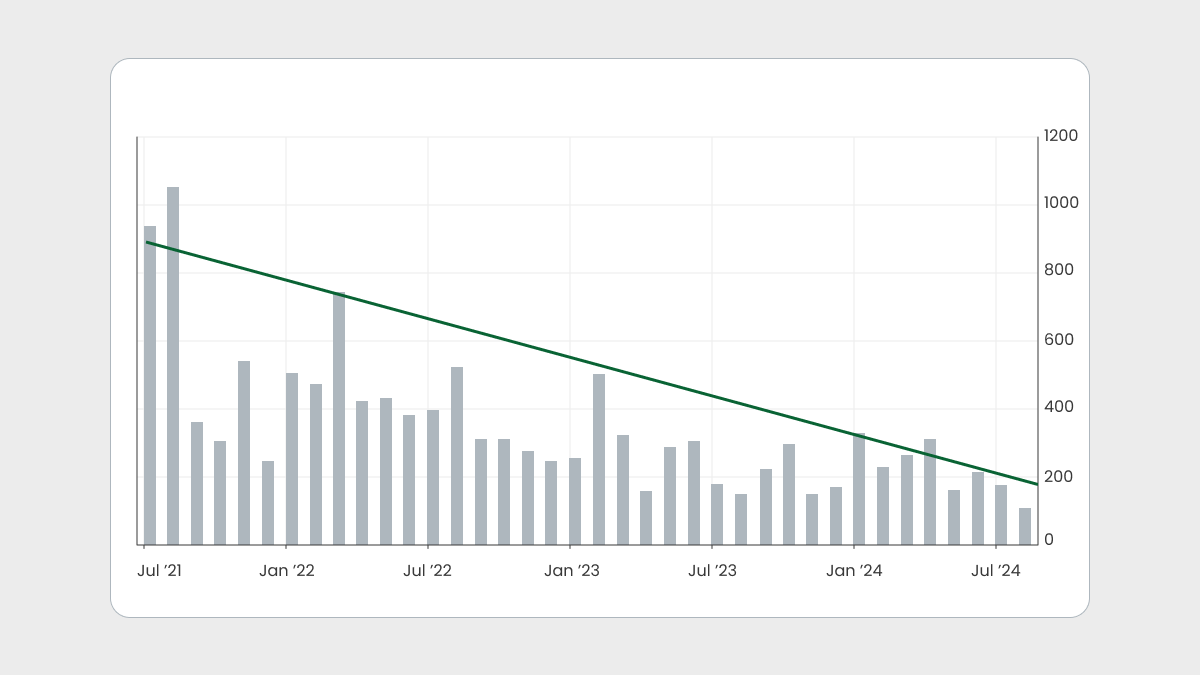
Friday’s NFP release came out worse than expected, highlighting the weakness of the US economy and leading Fed officials to reinforce their view of a key rate cut in September. This caused the stock market to fall. Such economic shifts lead to significant changes in market dynamics, opening up valuable trading opportunities.
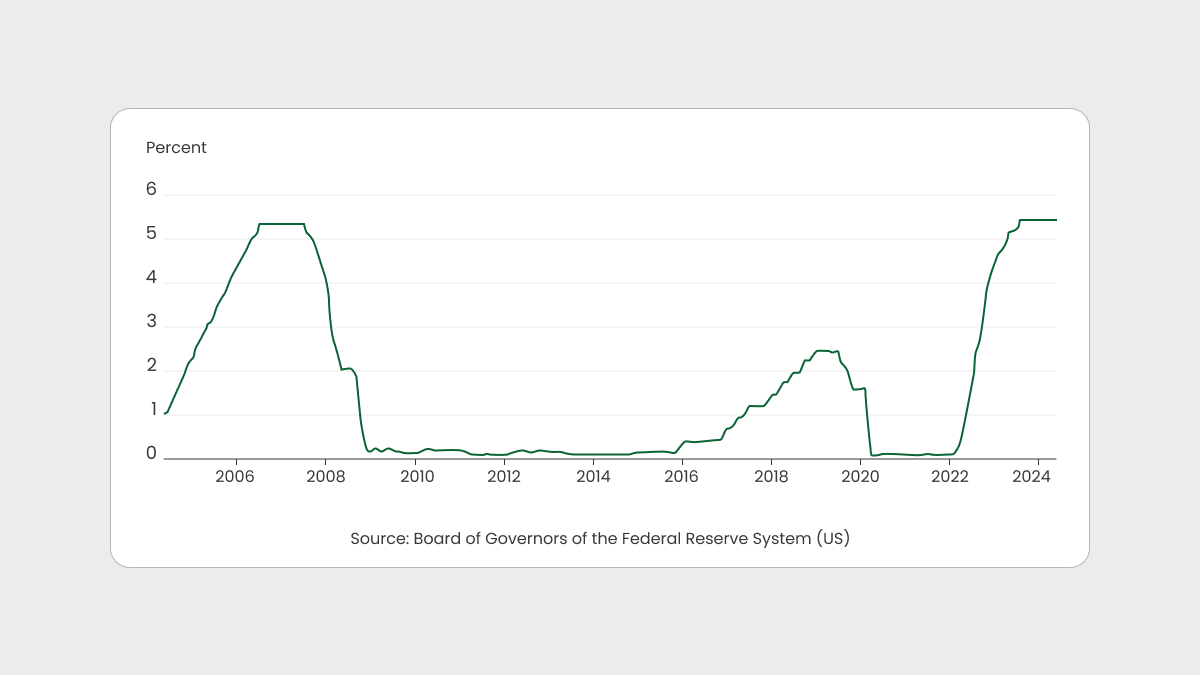
It’s widely known that the US Fed has hit its rate ceiling; the key question now is when it will start lowering rates. The Federal Reserve lowers the federal funds rate to stimulate financial activity when the economy slows. Usually, investors and economists view lower interest rates as catalysts for growth, which benefits personal and corporate borrowing. This, in turn, leads to higher profits and a strong economy.
Consumers will spend more because lower interest rates will make them feel that perhaps they can finally afford to buy more goods and services. Companies can finance operations, acquisitions, and expansions at a lower rate, increasing their potential earnings. This, in turn, will lead to higher stock prices.
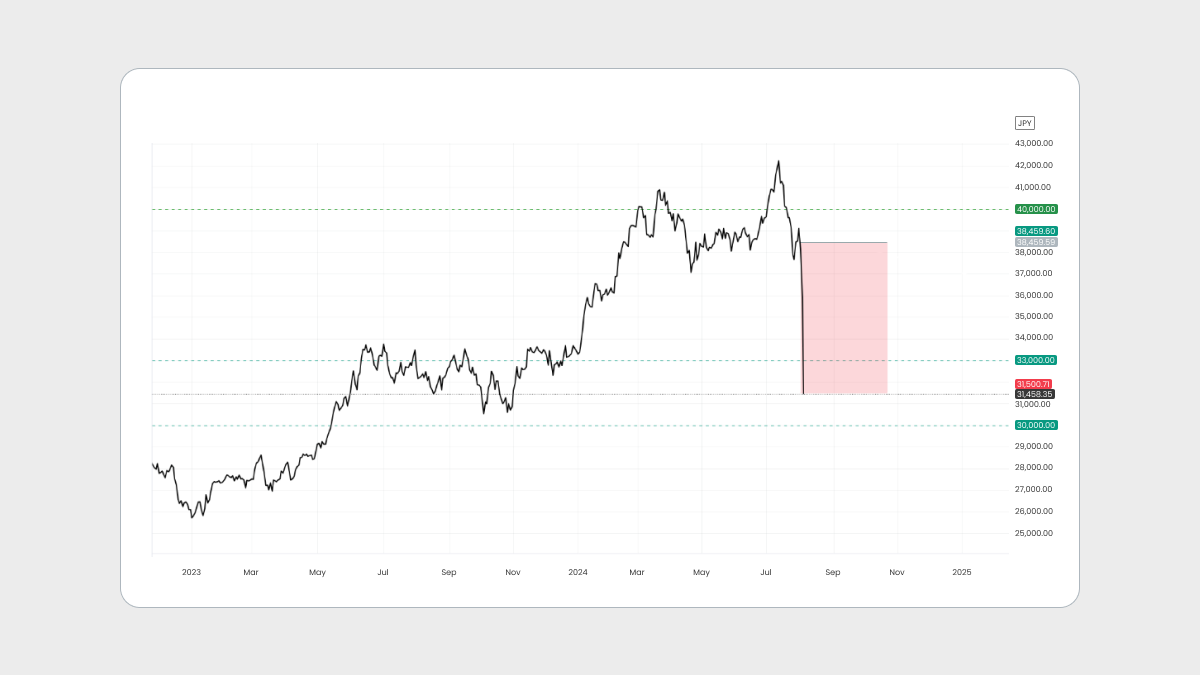
However, rate cuts have historically not always led to positive outcomes—such as the 2007 cuts preceding the 2008 financial crisis and the 2019 cuts leading to the 2020 market crash. As we see now, these actions have avalanched Asian and US indices. For example, JP225 fell by 12 percent at the opening of the trading session on Monday. Nevertheless, you can capitalize on both market rises and falls at FBS, as high volatility presents ample trading opportunities.
US Elections
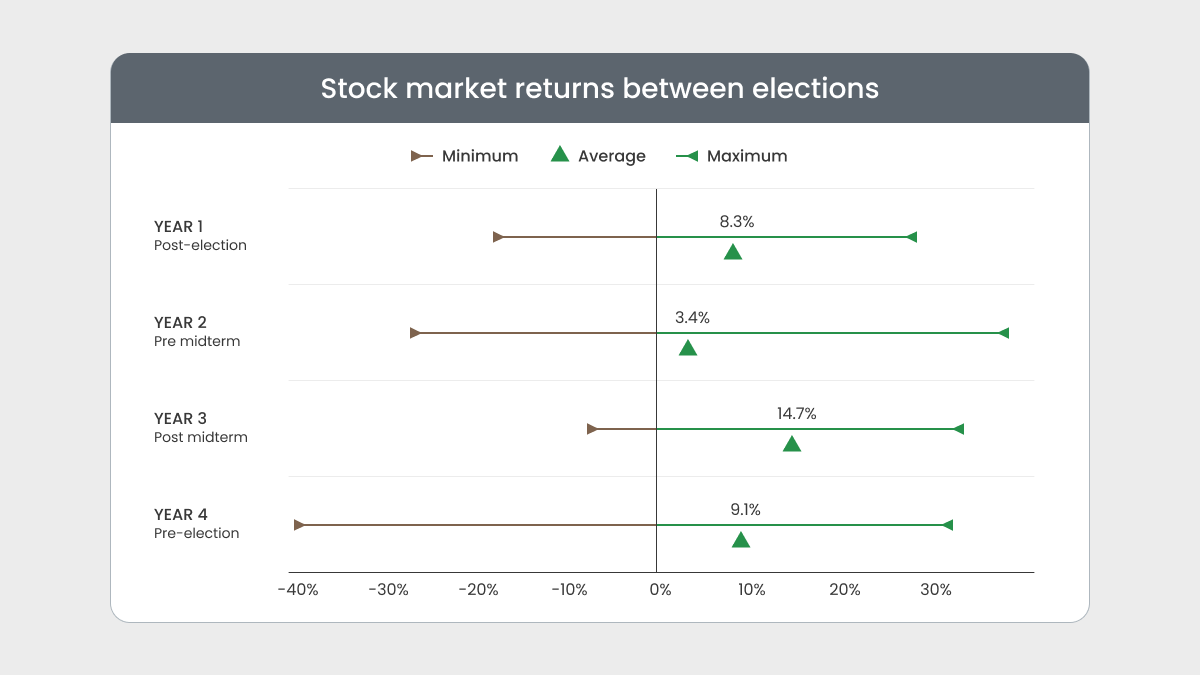
Historically, US markets experience significant volatility during the US presidential race.
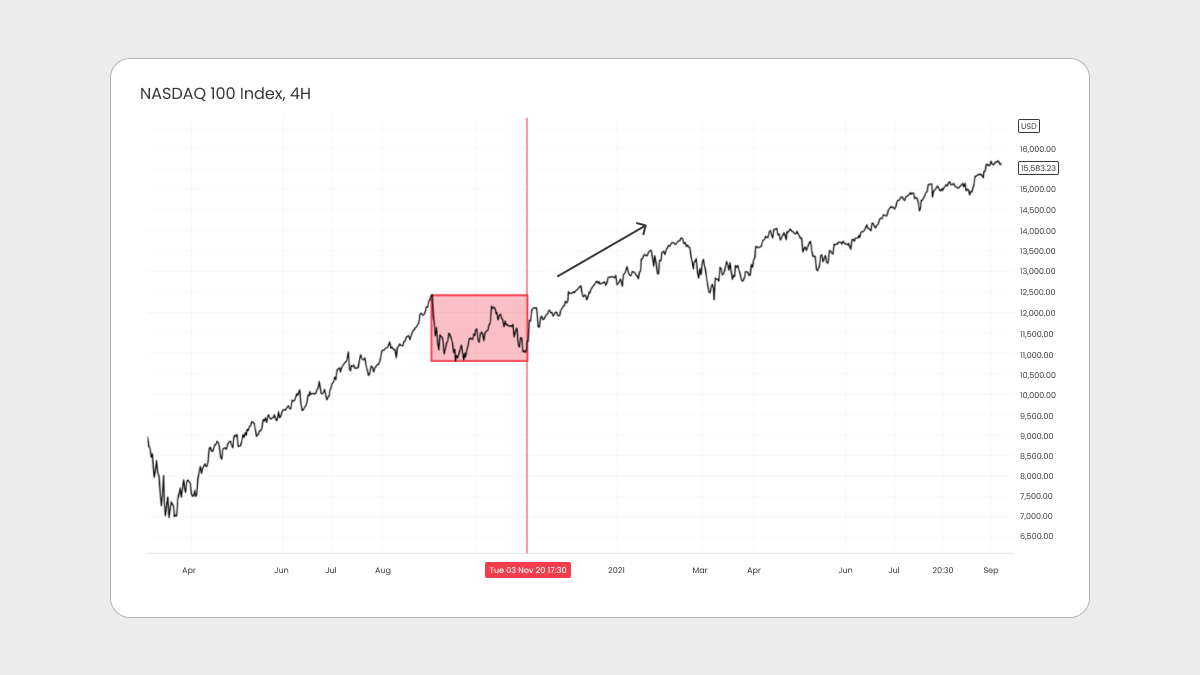
In the last presidential race in 2020, the Nasdaq Index (US100) experienced intense volatility and sideways movement before Election Day. However, the markets saw an upward trend after the election.
Research shows that since 1950, the average return of US stocks during election years has been 9.1%. The historical average stock market conditions over the 12-month periods between elections reveal the following:
in the first year after an election, the US500 return averaged 8.3%;
in the second year, 3.4%;
in the third year, 14.7%;
and in the fourth year, 9.1%.
This year, the world is closely watching the upcoming US presidential election on November 28. With three months left, the news is flooded with election-related updates. The market responds to this information; for instance, after the assassination attempt on former President Trump, the market saw a significant rise before stabilizing in the following days.
It’s also unclear whether the market prefers another Trump administration, a continuation of Biden’s, or another Democrat-led government. It seems more likely that the market doesn’t have a strong preference.
Reactions in the rates markets have been muted. Biden’s withdrawal has had limited impact on the rates markets, with minor changes in yields.