Bearish engulfing crack
Unlike the previous pattern, the bearish engulfing pattern consists of two candlesticks. The first candlestick is bullish and shows that the closing price is higher than the opening price and buyers are in control. The second candlestick is, on the contrary, bearish. It completely overshadows the bullish counterpart and indicates that on this day sellers prevailed over the buyers and pushed the price down.
Although this pattern is bearish, it does not necessarily signify a complete reversal in price movement. Prices can continue to go down and you can safely short your assets. Or they can climb up and disrupt your trading. That’s why it’s important not to look at this pattern alone before committing to a decision. Instead, look at the bigger picture: is the price of this asset on an upward or a downward trend? The answer to that question will put you on the right path. If the bearish engulfing forms after an upward correction in a bigger downtrend and near a big resistance level, the odds are that the sell signal is reliable.
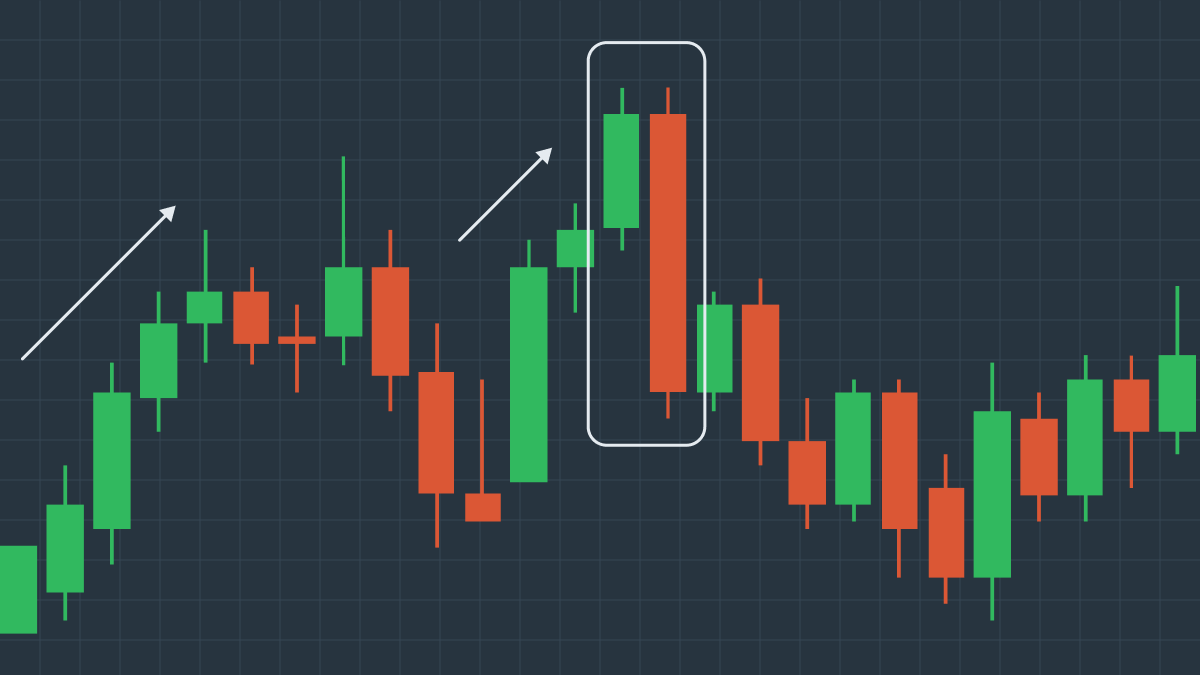
A bearish engulfing example
On this chart you can see how after a slight rise in price the bullish candlestick is immediately followed by a bearish one that completely engulfs it. This bearish engulfing pattern is followed by immediate price decline, which falls in line with the general downward trend of the asset’s price.
Evening star
An evening star is another bearish pattern that indicates the possible reversal of a price’s uptrend.
A typical evening star consists of 3 candlesticks. The first candlestick is bullish and shows a steady and fast increase in prices. The second candlestick is very short due to the decreased demand for the asset and slow increase in prices. Unlike the first two, the third and last candlestick of the pattern is bearish: the opening price on the third day is noticeably lower than on the second day and closes even lower. This candlestick indicates that on the third day it is the bears who have the upper hand, and prices start to drop.
Evening stars are considered reliable markers of a continued downtrend in price movement.
An evening star example
This chart illustrates a typical evening star. The price of the asset is growing slowly, but surely, when it suddenly spikes, then evens out, and just as suddenly decreases, signaling a new downtrend.
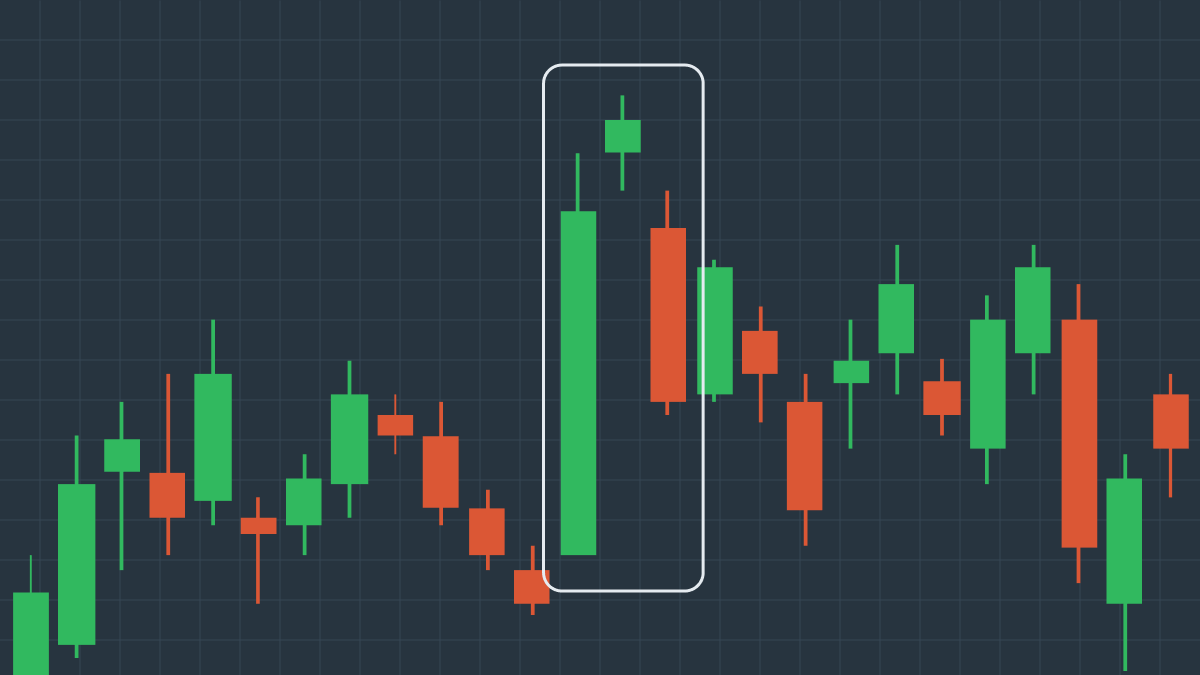
Tweezer top
A tweezer top is another 2-candle bearish pattern. It is easily recognizable on price charts as both candlesticks have almost identical highs and occur back to back.
The difference between them is that the first candlestick is bullish, indicating that bulls have managed to drive up the price, while the second candlestick is bearish, showing that bears have pushed the prices down instead.
This pattern shows that an asset’s price has reached the highest point possible at that particular time and that the buyers are not willing to buy any more of the asset for an even higher price. This chart shows the start of a natural downtrend in price movement for this particular asset.
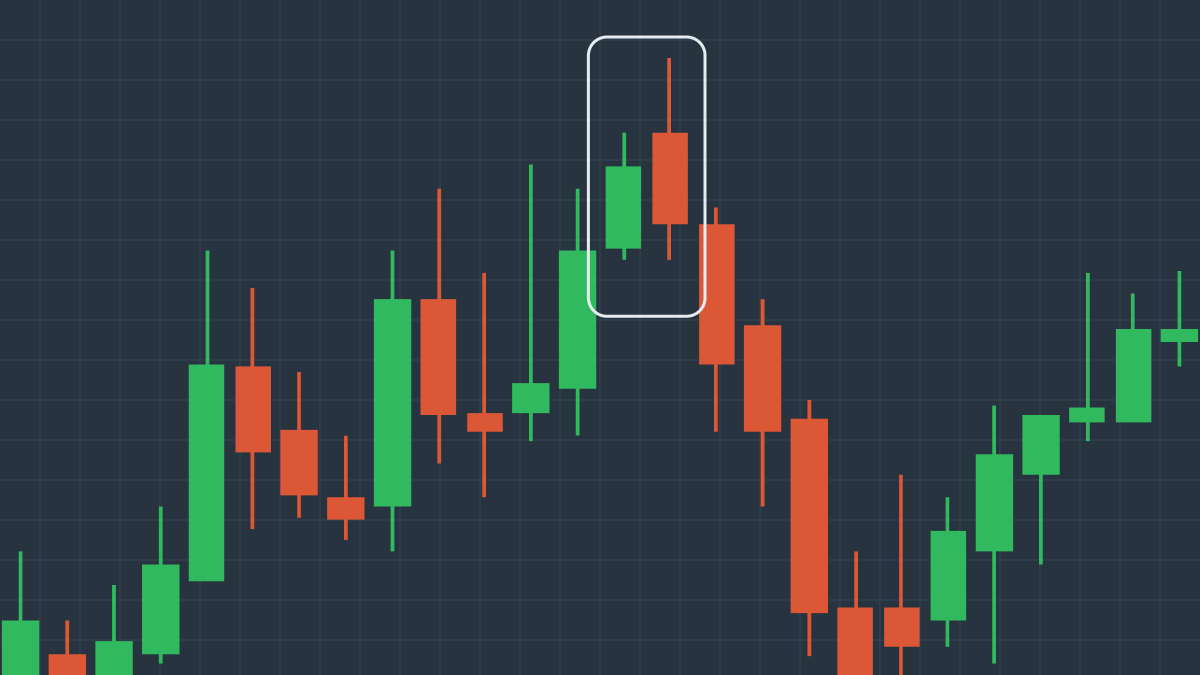
A tweezer top example
As seen on this chart, a tweezer top is a pattern that occurs near the top of an uptrend, with a bearish candlestick following a bullish one at approximately the same height. After the tweezer top, the price begins to decline because the bears continue to influence the asset price the most.
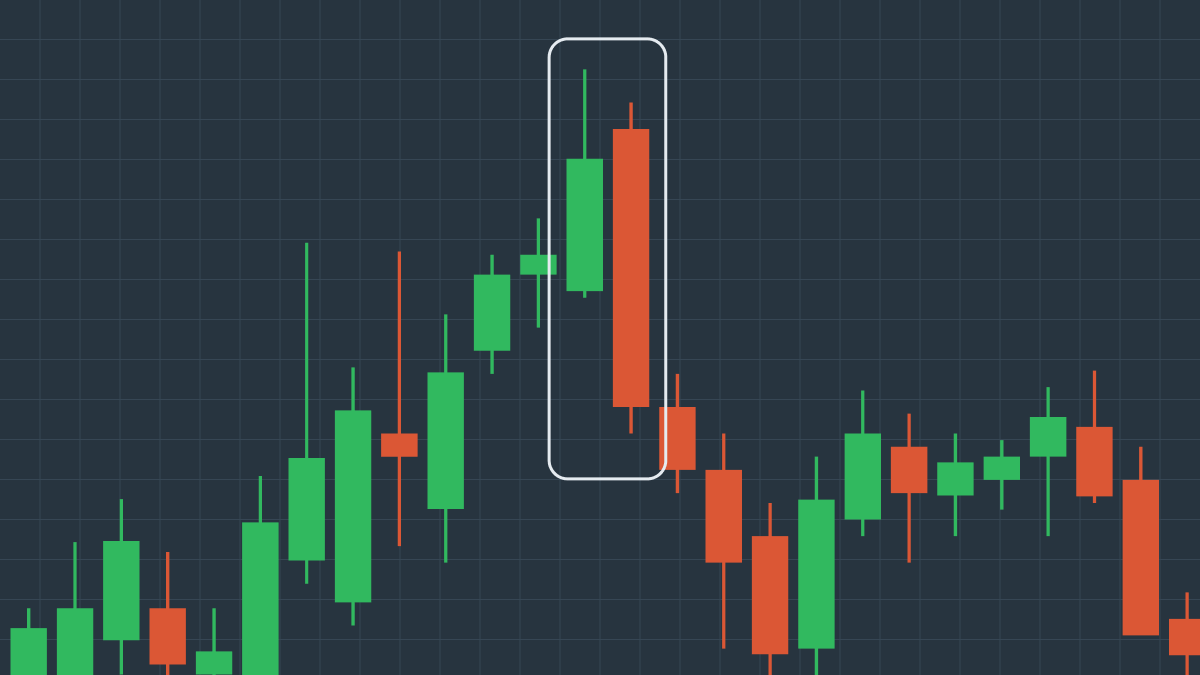
Dark cloud cover
A dark cloud is another bearish candlestick pattern that potentially predicts a reversal of price movement.
A dark cloud consists of two candlesticks: a bullish candlestick and a bearish one that opens higher than the previous candle and closes near its midpoint. This pattern shows that during the second day the buyers managed to push the prices higher, but the sellers quickly took over and pushed them down.
The dark cloud is not foolproof. You need to identify a clear uptrend to be sure that a dark cloud is predicting a downturn.
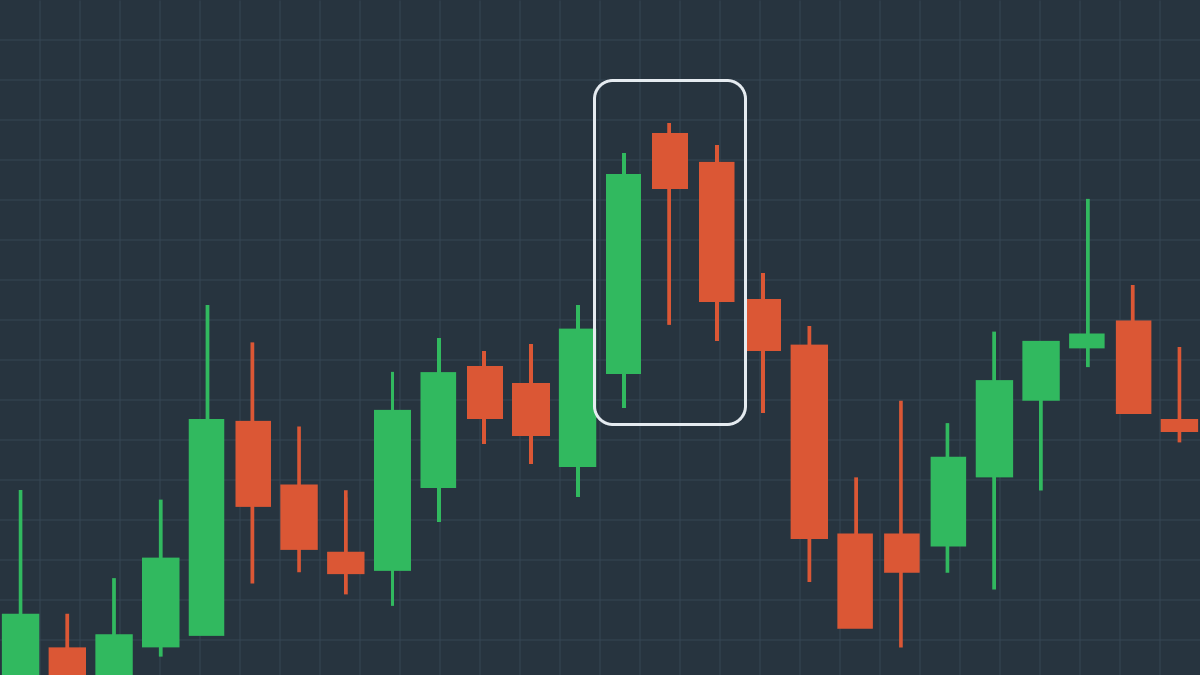
A dark cloud cover example
This chart shows how a dark cloud can actually be interpreted as a sign of an impending downturn. You can clearly see that the asset prices are on an uptrend. Then, a bullish candlestick is suddenly followed by a bearish one that opens higher but closes at the middle of the previous candlestick. This pattern is further followed by a series of bearish candlesticks, indicating the start and continuation of a new downtrend.
Shrinking candles
A shrinking candles pattern consists of multiple candlesticks, each of them smaller than the previous one, resulting in a price movement reversal.
The reason is the imbalance between the demand and the supply of the asset: when a lot of sellers want to sell one asset and not many buyers are looking to buy it, the price of this asset will inevitably fall. Shrinking candles can help predict this outcome as the shrinking size of the bullish candles indicates the decrease in prices.
A shrinking candles example
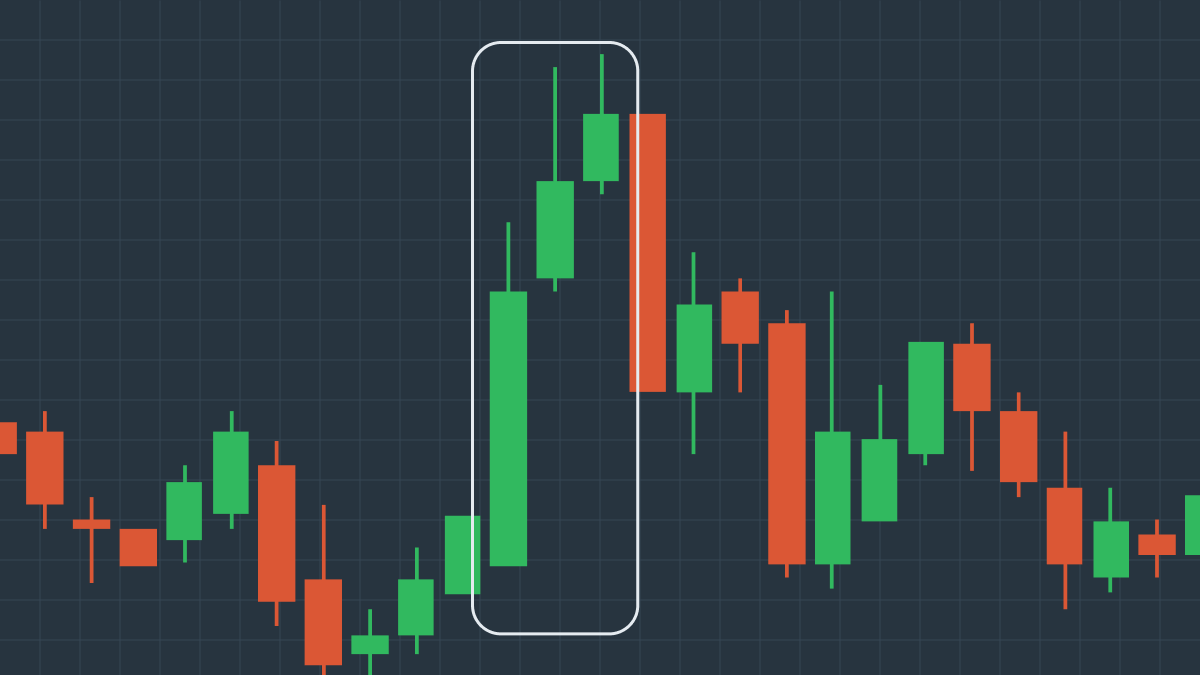
On this chart we can see the way a bullish candlestick is followed by two much shorter candles, culminating in a bearish candle with a closing price lower than the second candle’s low. This demonstrates how, despite all the efforts made to push the price higher, sellers win out.
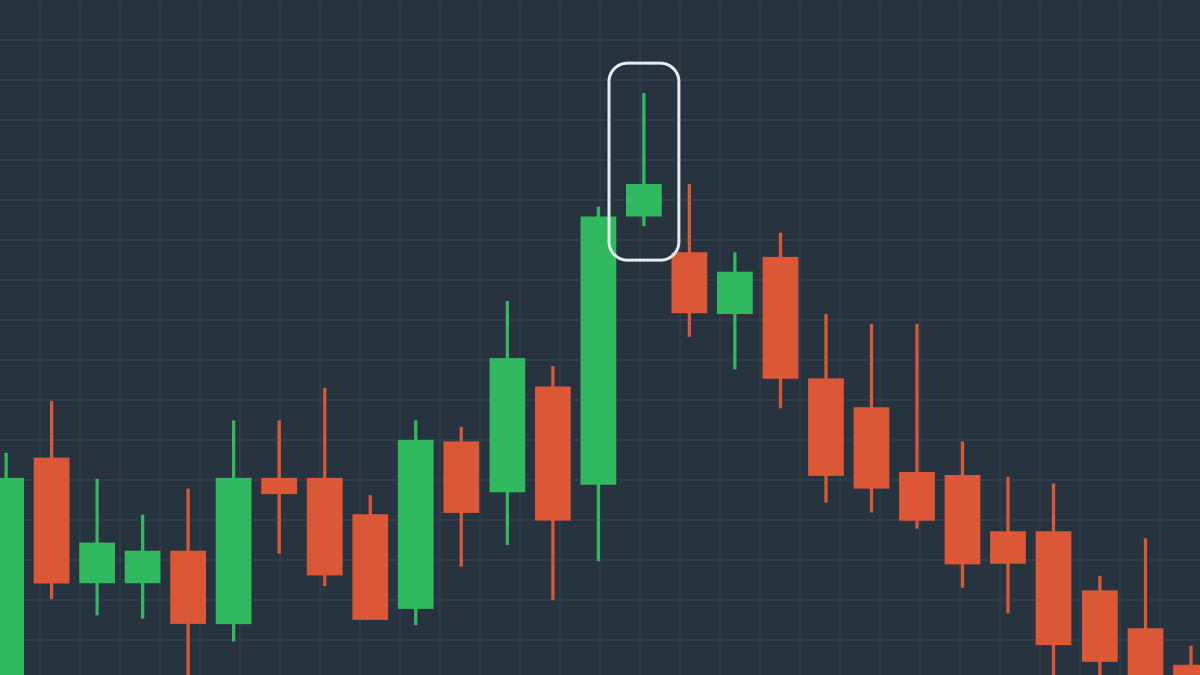
Hanging man
A hanging man is a bearish candlestick pattern that indicates a moderately high probability of price decrease.
This pattern actually consists of one candle with a short body and a long wick. The body is located at the top of a candle’s range. The pattern can be both bullish and bearish and usually appears at the top of an uptrend. A hanging man shows that there’s a very noticeable selling pressure on the asset, which turns the price movement downward. However, a hanging man is not the most reliable indicator of reversals in prices, so it’s important to look for other signs to reinforce your prediction.
A hanging man example
This chart illustrates a steady increase in asset prices, but a short candlestick with a long wick suddenly appears at the end of the uptrend, changing the course of the price movement, starting a new downtrend. It’s important to act quickly when you see this pattern; but do look at the bigger picture of current changes in asset prices.
Three black crows
The three black crows is another bearish pattern that indicates the possible reversal.
As you can guess from the name, this pattern consists of three (often long-bodied) bearish candlesticks that open higher than the previous candle, but close much lower. This pattern shows that sellers have managed to push the price of an asset down three times in a row and now overtook buyers.
Three black crows is a very noticeable bearish pattern, but it’s still essential to use other technical indicators to confirm that it really does predict a downturn in asset prices.
A three black crows example
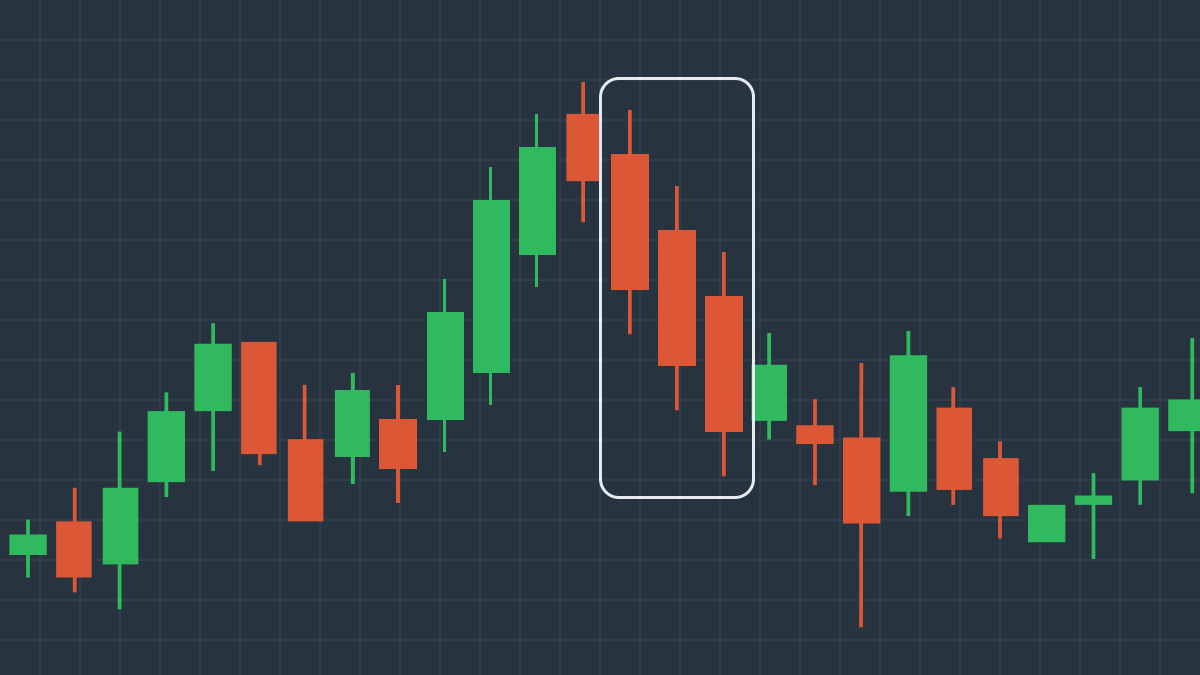
This chart shows a slow, but steady uptrend with very few bearish candlesticks sprinkled here and there. That is, until we encounter three bearish candlesticks with very short wicks, closing far below each other. After that, the price movement took a downturn, indicating that the three black crows pattern is actually a pretty reliable indicator of a price decrease.
If you would like to further master Japanese candlesticks patterns, check out the free FBS courses.