US100, Daily

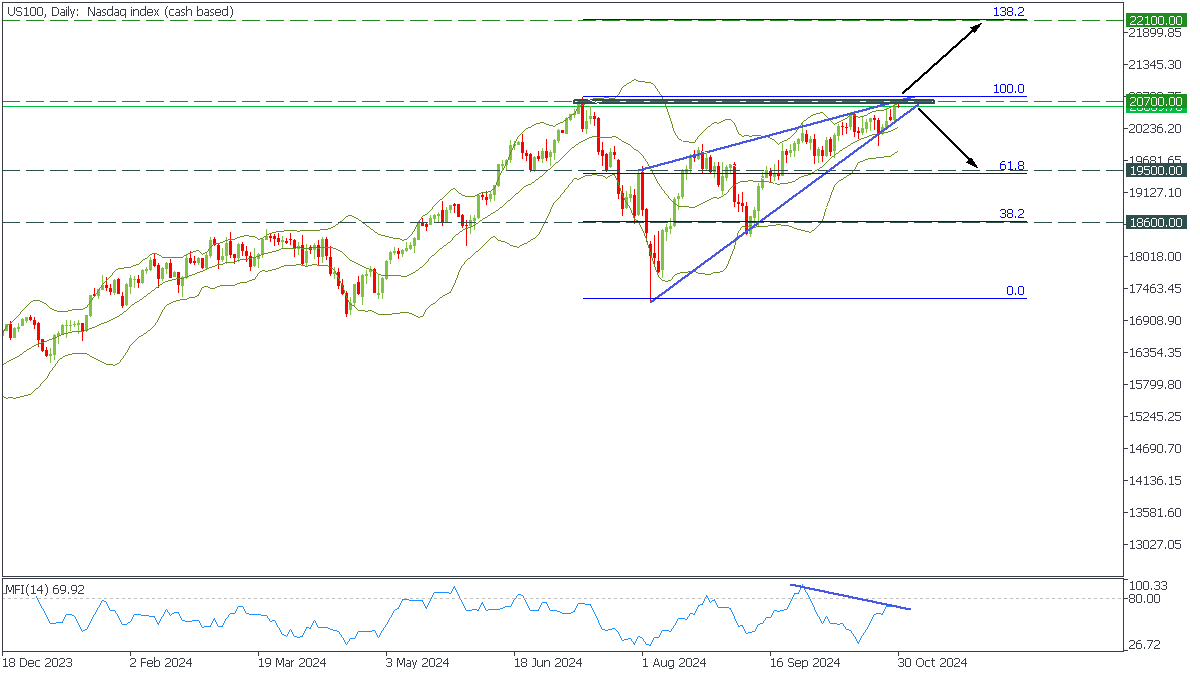
In the Daily timeframe, US100 has formed a rising wedge pattern. The price reached an all-time high again, with the upper Bollinger line crossed. There was also a divergence formed on the MFI.
- If the price breaks the 20700 resistance, the long-term bullish trend will continue to 22100;
- A break of the lower trendline will start the bearish scenario to 19500;
