Brent oil prices broke below the $72.06 level and ended the day below it, signaling a continuation of the bearish trend. This opens the door for further declines, with the following targets at $71.15 and potentially $70.00 if the downward momentum continues.
Negative pressure from the EMA50 indicator supports the bearish outlook. However, this trend remains valid if the price doesn't rebound and breaks back above the $72.06 level.
Today's expected trading range is between the $70.00 support and the $73.00 resistance levels.
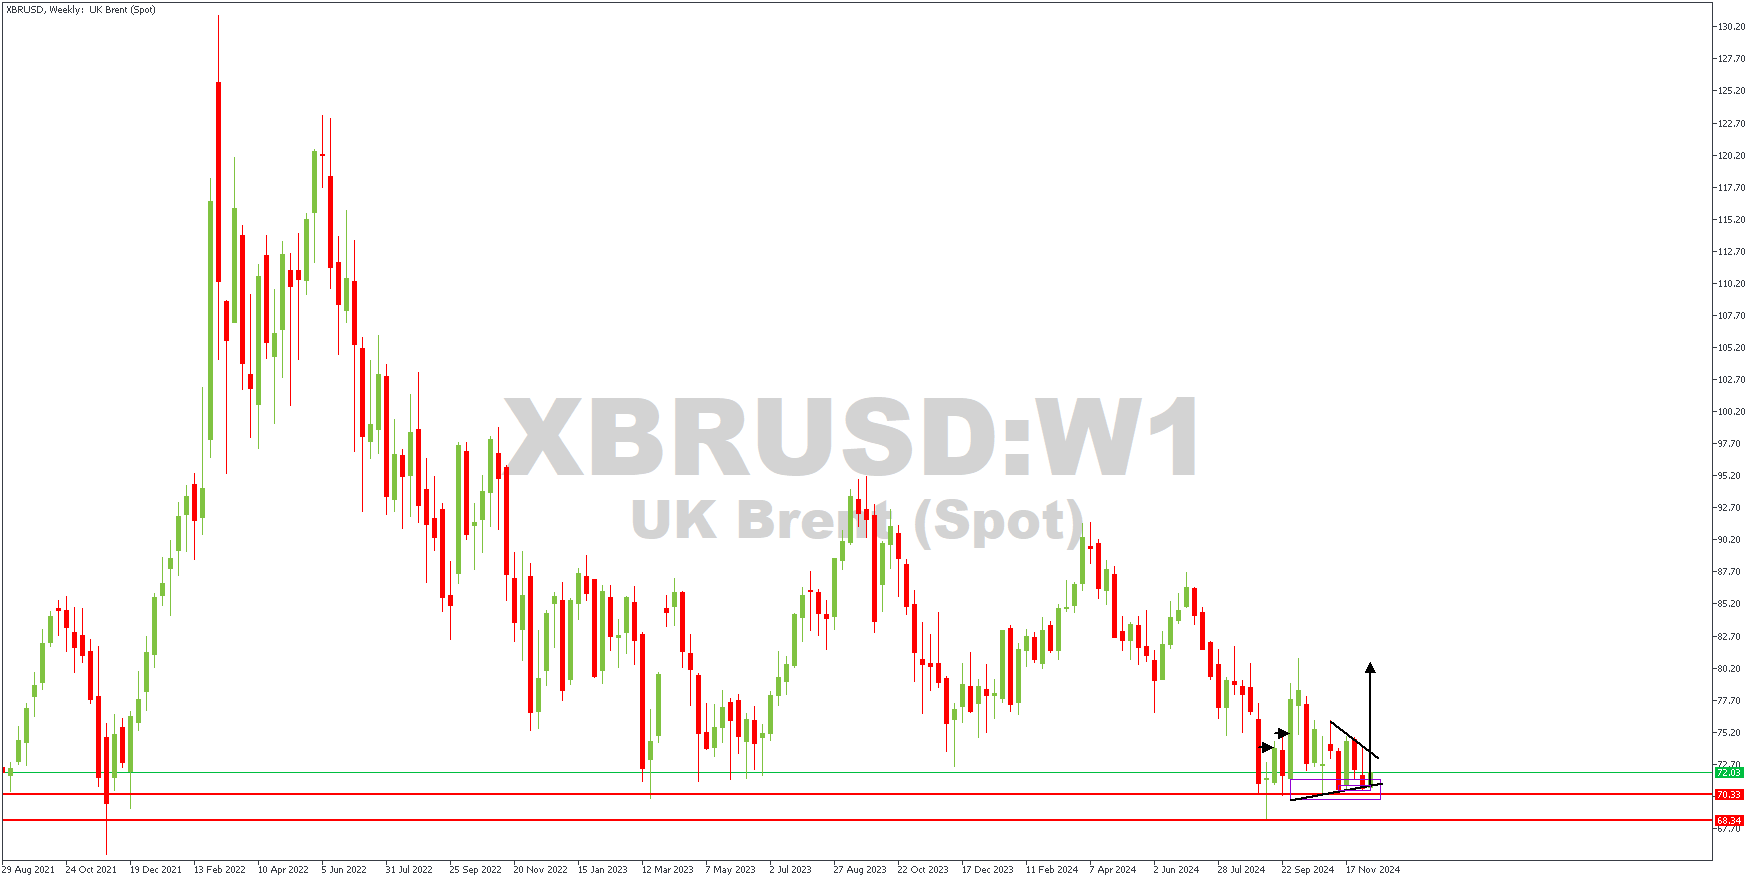
XBRUSD– W1 Timeframe

Brent Oil on the weekly timeframe chart is trading near a pivot region, with the current price action consolidating between the trendlines of a wedge pattern. Considering that the trendline support of the wedge pattern aligns perfectly with the pivot zone, there is supporting a bullish outcome. However, the lower timeframe can provide the final piece of the puzzle.
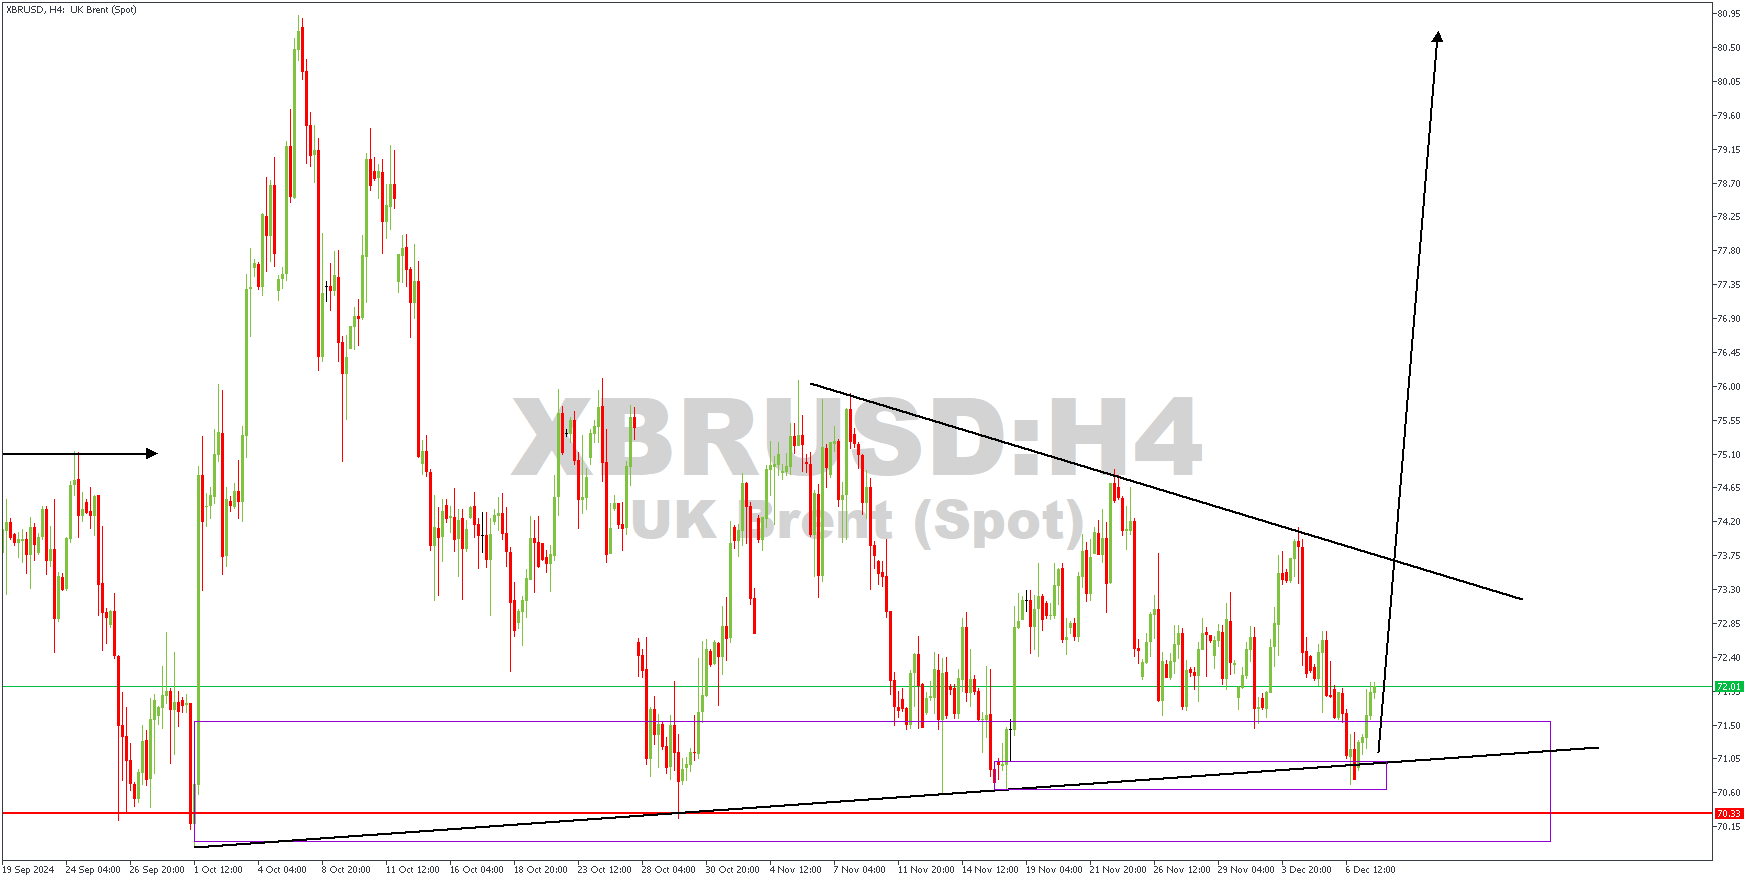
XBRUSD – H4 Timeframe

On Brent's 4-hour timeframe chart, we observe a double break-of-structure pattern, the demand zone of which has recently been tested with a reaction. Since there is a pre-existing bullish sentiment from the higher timeframe, this tiny bit of information can be considered a confirmation of the bullish sentiment.
Analyst's Expectations:
Direction: Bullish
Target:74.15
Invalidation:70.55
CONCLUSION
You can access more trade ideas and prompt market updates on the telegram channel.


