Moving Averages Ribbon: How to Find Entry Point
What is MA Ribbon?
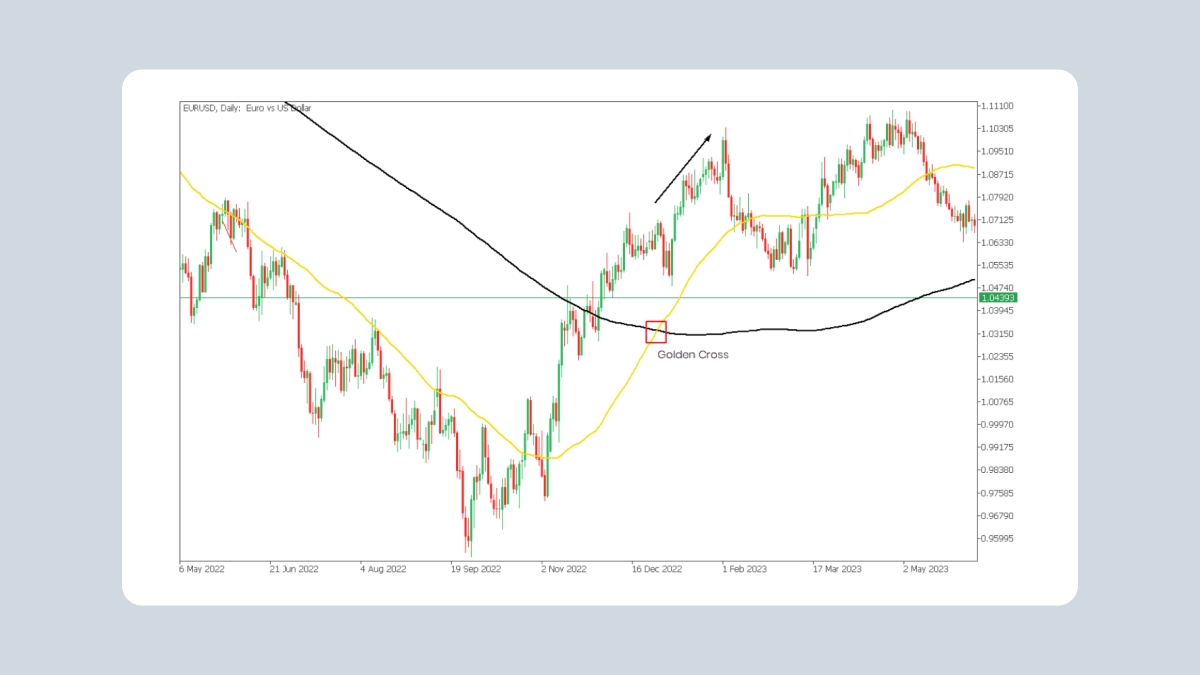
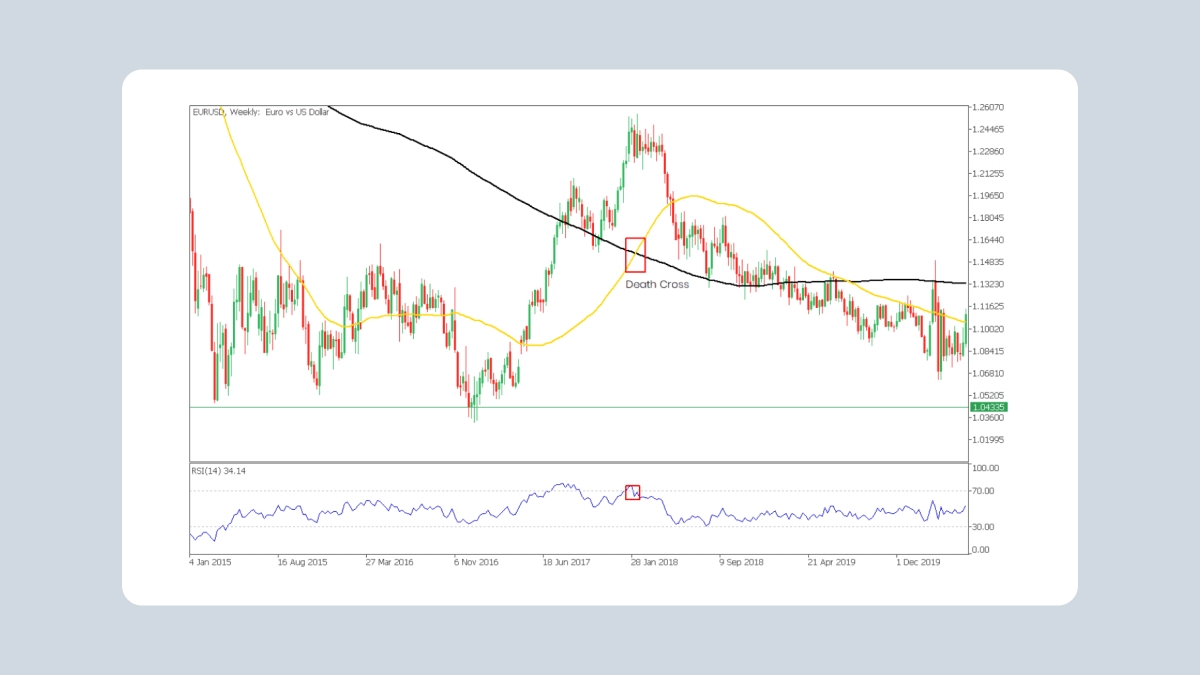
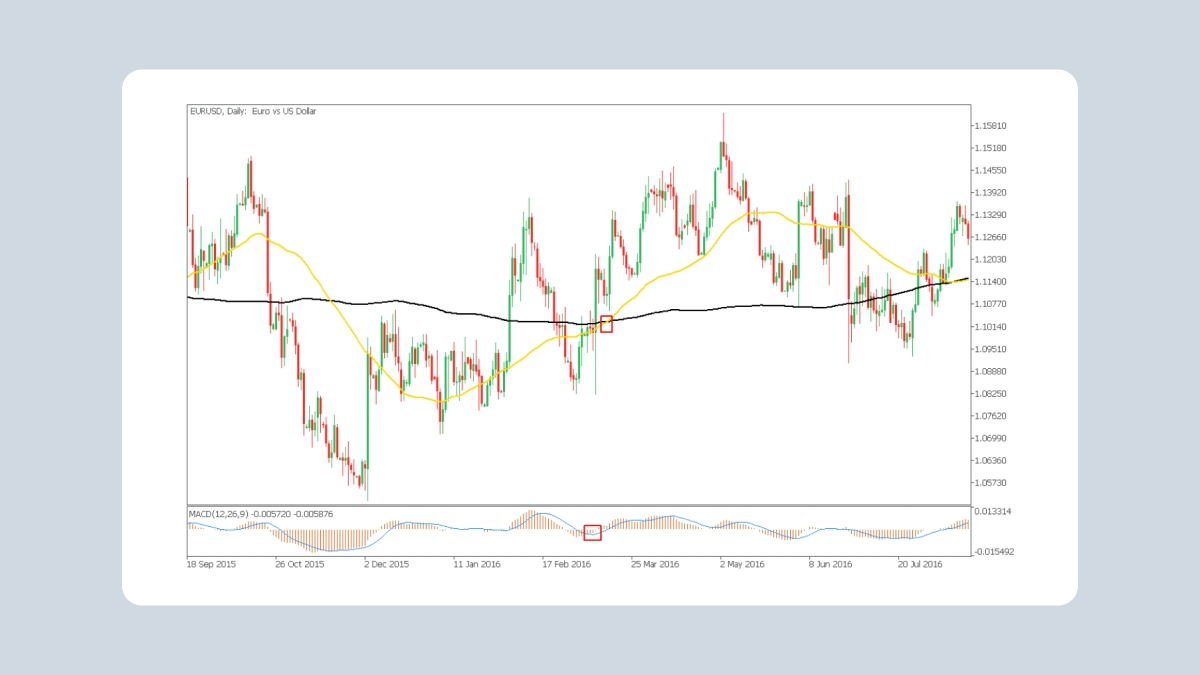
Moving average ribbons are a series of moving averages (MA) of different lengths that are plotted on the same chart to create a ribbon-like indicator. Traders can determine the strength of a trend by looking at the distance between the moving averages. The ribbons can also be used to signal potential trend changes when the price moves through lines, or lines cross each other.
You can download this indicator for MT5 using the link!
How to set up a Moving Average Ribbon?
It is all about traders’ preferences. Some traders like to use six to eight simple moving averages (SMA) set at 10-period intervals, such as the 10, 20, 30, 40, 50, and 60-day SMAs. Others prefer to use only two lines and open trades when the lines cross each other.
Traders can also choose between types of moving averages. Some of them prefer simple and others use exponential lines. The EMA reacts quicker to price changes and the SMA reacts slower. That is the main difference between the two. One is not necessarily better than another. Sometimes the EMA will react quickly, causing a trader to get out of a trade on a market hiccup, while the slower-moving SMA keeps the person in the trade, resulting in a bigger profit after the hiccup is finished. At other times, the opposite could happen. The faster-moving EMA signals trouble quicker than the SMA, and so the EMA trader gets out of harm's way quicker, saving that person time and money.
Each trader must decide which MA is better for his or her particular strategy. Many shorter-term traders use EMAs because they want to be alerted as soon as the price is moving the other way. Longer-term traders tend to rely on SMAs since these investors aren't rushing to act and prefer to be less actively engaged in their trades.
Also, traders can choose the MA period. The lower meaning of period makes MA reflect more precisely on price changes.
How to trade with MA Ribbon?
This article will describe the simplest example of MA ribbon, but it is not less effective. On the contrary, it will protect traders from the market’s hiccups.
In this strategy, only 2 moving average lines are used. One is the “fast MA” line and the other is “Slow MA”.
We have chosen settings that are designed for daily and long-term traders.
The settings are:
Fast time frame: current
Fast MA period: 12
Fast MA method: Simple moving average
Fast MA price: Close
Slow time frame: current
Slow MA period: 85
Slow MA method: Exponential moving average
Slow MA price: Weighted
As a result, we get 2 lines. If the fast line crosses the slow one from the bottom, an uptrend will begin. On the contrary, the downtrend starts if the fast line crosses the slow one from the top.
Let’s look at the example!
1H BTC Chart
Using the MA ribbon strategy trader could open the deal after the fast line crossed the slow one ($30700 level on the chart). It is important to set a stop-loss. If it is a long trade, traders set stop-loss below an entry point. If it is a short one, traders set stop-loss above an entry point. In our case, stop-loss must be set right below $40700. The position closes when lines cross each other again ($40650 level on the chart) or if the price reaches the trader’s target.
Let’s look at one more example!
4H EUR/USD chart
On the EUR/USD chart the place of hiccup appearance is highlighted. It is a great example of stop-loses importance as during flat market movement lines might cross each other several times in both directions.
Conclusions
- Traders can set this instrument according to their strategy and a time frame they prefer to use. For daily traders, it is better to use EMAs and set lower meanings period meanings.
- It is highly important to use stop-loses.
- Traders must set targets before they open a trade or take profit after the lines cross each other the opposite way.
2022-10-10 • Updated
Other articles in this section
- The McClellan Oscillator
- Aroon Indicator Trading Strategy
- Currency strength
- Best Time Frames for Trading
- Renko charts Japanese candlestick chart
- Types of charts
- How to Use a Heikin-Ashi Chart?
- Quantitative Easing Policy (QE)
- Pivot Points
- What Is a ZigZag Indicator?
- Moving Average
- Williams’ Percent Range (%R)
- What Is Relative Vigor Index (RVI Indicator)?
- Momentum
- Force index
- What Is Envelopes Indicator?
- Bulls Power and Bears Power
- Average True Range
- How to trade on central bank decisions?
- CCI (Commodity Channel Index)
- Standard deviation
- Parabolic SAR
- Trading with Stochastic Oscillator
- Relative Strength Index
- MACD (Moving Average Convergence/Divergence)
- Oscillators
- ADX Indicator: How To Use It For Effective Forex Trend Analysis
- Bollinger bands
- Trend indicators
- Introduction to technical indicators
- Support and resistance
- Trend
- Technical analysis
- Central Banks: policy and effects
- Fundamental factors
- Fundamental Analysis in Forex and stock trading
- Fundamental vs technical analysis