Fed meeting: what to watch
The Federal Reserve meeting is today at 21:00 MT time followed by the press conference with the Fed Chair Jerome Powell at 21:30 MT time. Analysts widely expect the Fed to keep rates on hold at the 1.5%-2% range after the surprisingly strong job data released on Friday. NFP advanced by 266 thousand, while the unemployment rate fell to 3.5%, leaving analysts wondering what the next step by the Fed is going to be. So, what do we need to watch during the meeting?
Follow the forecasts
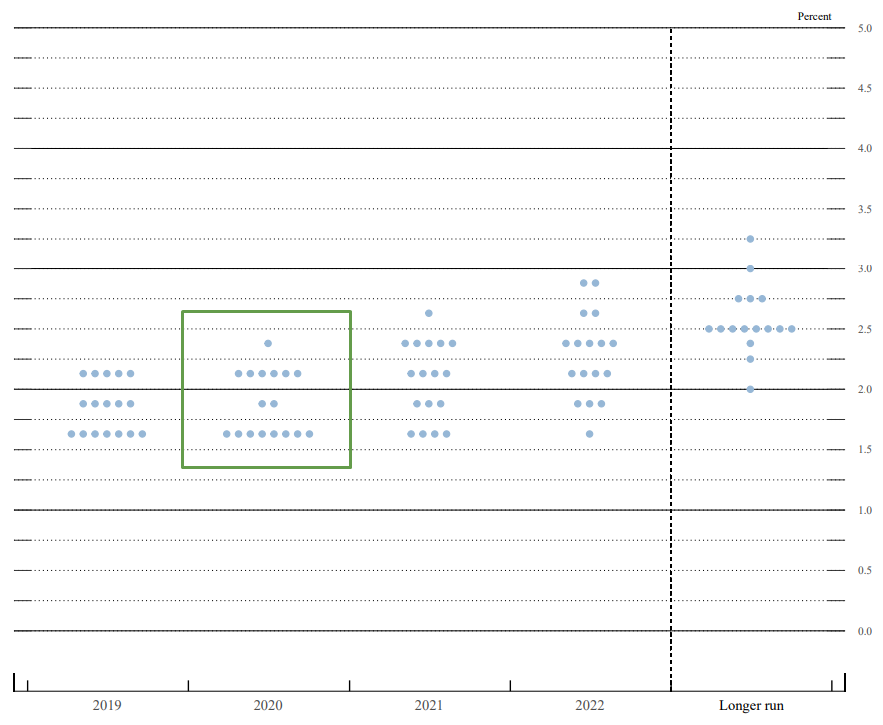
The Federal Reserve will publish a new summary of economic projections, which include the “dot plots”. The “dot plot” shows the predictions of each FOMC member on where the interest rates will be in the next three years. These plots are not as complicated as they may seem. One dot stands for one person. The more dots are placed in one line, the more policymakers forecast this rate to be set. In the previously released dot plot, most of the Fed representatives expected the interest rate to be within the 1.5%-1.75% range. There was only one FOMC member, who forecast the shift to the upside at the end of 2020.

Sourced by Chair's FOMC Press Conference Projections Materials, September 18, 2019
As the forecasts during September’s release varied a lot, it would be interesting to see the changes. If more FOMC members will place their dots higher than the current range, the USD may rise. On the contrary, if they shift their views to the downside, the USD will likely fall.
Pay attention to the Fed Chair comments
The Fed Chair Jerome Powell will be responsible for the market’s volatility during the press conference. His comments regarding the risks for the economy, the economic uncertainties, cautious steps and accommodative stance of the monetary policy may weaken the USD. However, his “wait-and-see” attitude may also leave the USD without major changes.
Where to watch Mr. Powell?
You can watch the official broadcast on the Fed website.
What to trade during the meeting?
Keep in mind that all USD pairs will get volatile on the release. FBS analysts recommend some charts for your consideration.
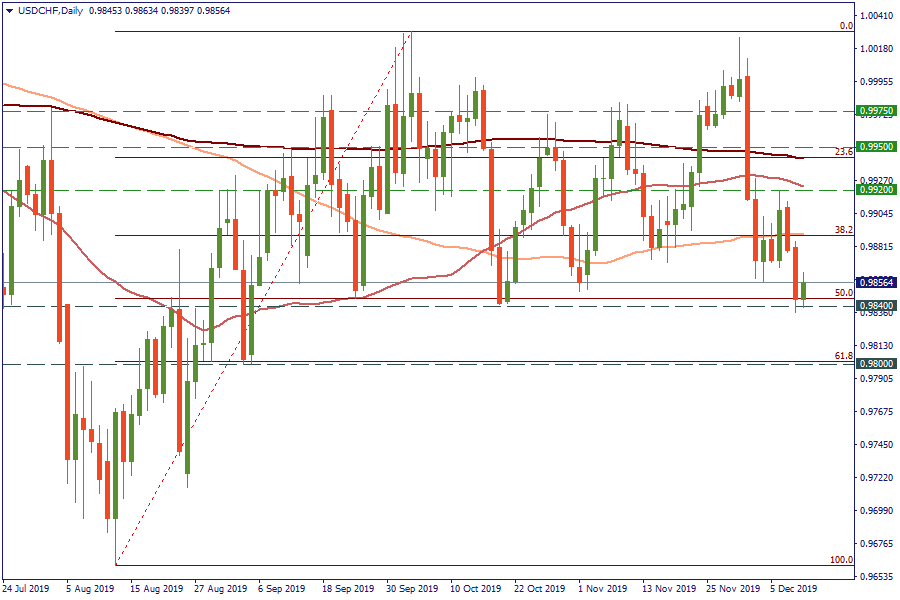
Let’s look at USD/CHF. On the daily chart, the pair has been consolidating within a wide range since October. This week, USD/CHF has managed to break the 100-day SMA. After that, the further downward momentum was limited by the 0.9840 level (50% Fibo). If the Federal Reserve is dovish, the breakout of the current support is likely to happen. Bears will pull the pair as far as the 0.98 level will be reached. From the upside, the resistance levels are at 0.9920 and 0.9950.

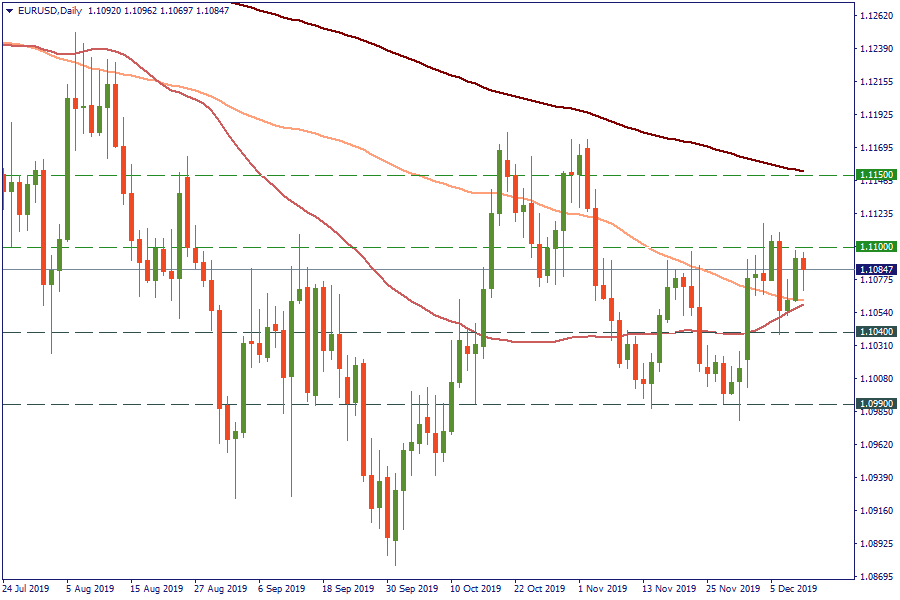
EUR/USD inched higher to the 1.11 level on the daily chart yesterday. This level acts as a strong resistance since September. On H4, EUR/USD has tested the crossover of 50- and 100-period MAs. If the Fed is hawkish, EUR/USD will slide towards the 1.1040 level. If bears break this support, the next one will lie at 1.0990. In case of an alternative scenario, the levels from the upside will lie at 1.11 and 1.1150.

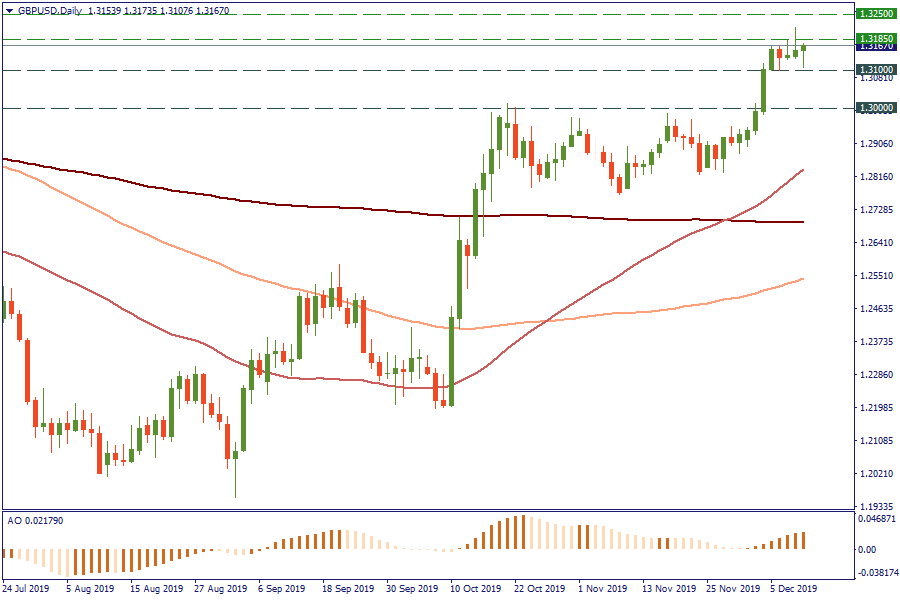
GBP/USD is consolidating at its highest levels since March on the daily chart. The hawkish Fed may pull the pair below the 1.31 level straight to 1.3. The negative tone will help bulls to break the 1.3185 level and push the pair to the next obstacle at 1.3250.
