Brent and S&P500 Trade Idea for the Upcoming Week
What happened?
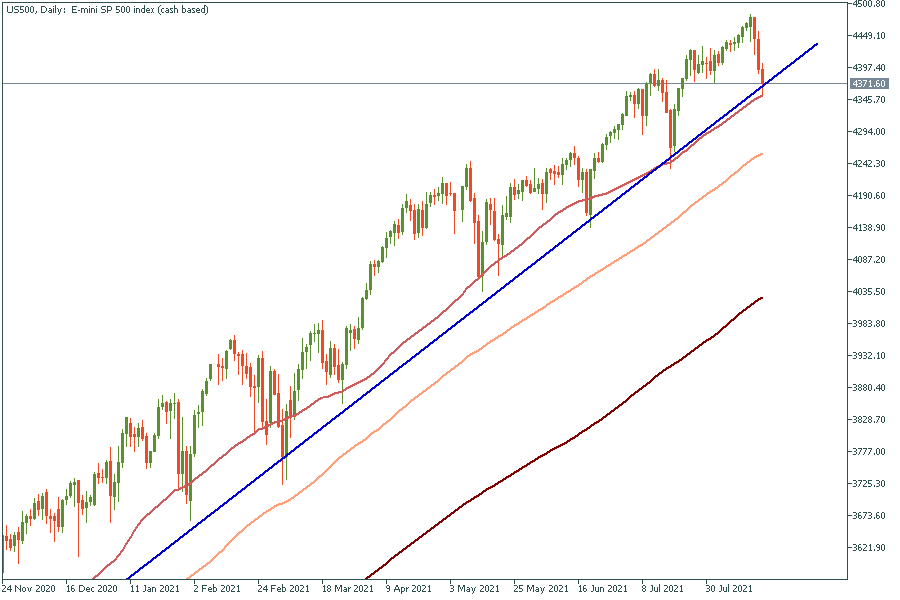
The latest minutes of the Federal Reserve’s meeting showed most Fed officials agreed they could start slowing the pace of bond purchases later this year given the progress made toward inflation and employment goals. That brought a lot of fear to the markets as S&P500 dropped to the bottom of the rising channel and NASDAQ fell to the 50-day moving average. Today traders await
the release of the US unemployment claims and Philly Fed Manufacturing Index.
Technical analyses
Let’s start with Brent as oil is the main markets’ driving force.
Brent, 4H chart

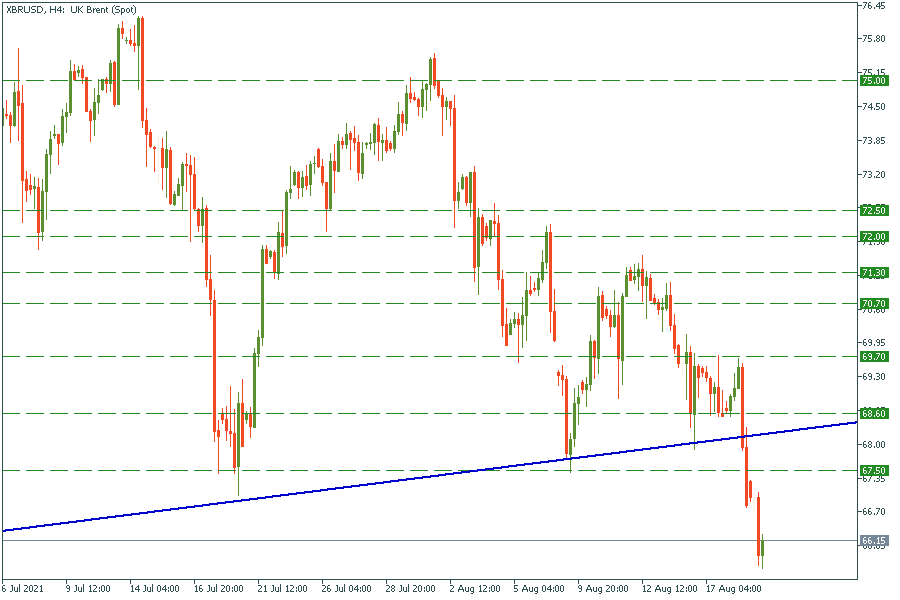
Brent broke through the support line which used to hold it since May 2021. As usually happens, when price breaks through the massive level it returns and tests it once again. That’s why we assume Brent to return in the $68-69 range.
US500, Daily chart

US500, 4H chart

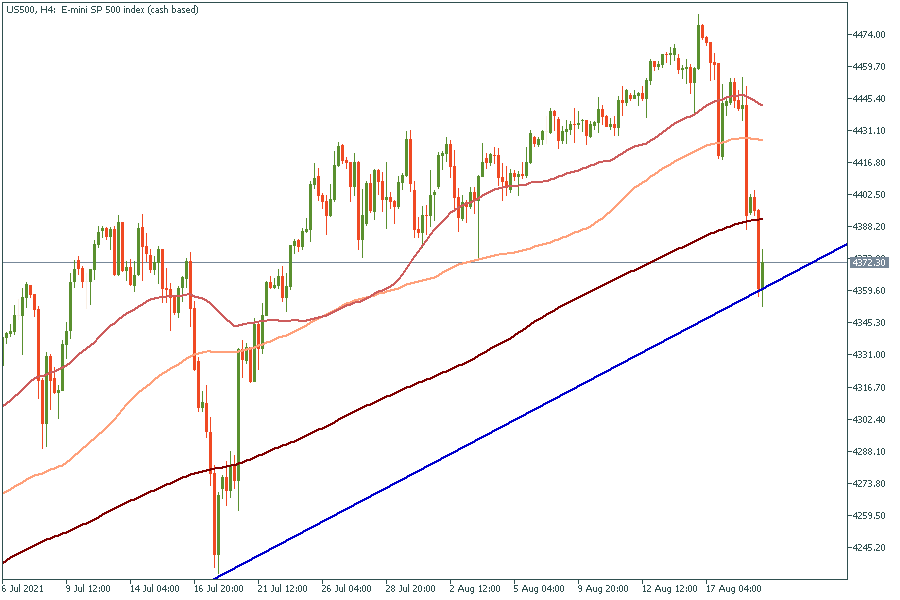
It is important to watch both assets, as changes in oil price tell us about the perspectives of economic recovery. It might be a good time to open US500 short trade as soon as Brent reaches the support line for a retest. Until then, it is a long trade opportunity.