Analysts Lower Forecasts for S&P500
Due to geopolitical news, commodity prices have become insane, as it was expected. Private groups and governments are trying to impose an embargo on using Russian natural resources, in particular oil, gas, and coil. As a result, oil prices jumped over the weekend. Natural gas in Europe rocketed to $3700 on March 7.
The US government considers that sanctions against Russia won’t influence them too much, however, expensive oil reduces economic forecasts. A quick CNBC update reveals that the average US gross domestic product (GDP) growth forecast for the first quarter is just 0.5%. Strategists and analysts from Citi (C), UBS (UBS), Yardeni Research and Evercore ISI cut their outlook on US stocks due to the Russian-Ukrainian conflict. In addition, the AMEX Airline Index (XAL) fell 13.27% on Monday as investors decided to sell airline stocks given higher fuel costs.
The S&P 500 (SPX) broke the $4300 support level that has been stable since July 2021 and tested it several times after WTI crude oil futures surged over the weekend, trading as high as $130 a barrel, as a growing number of companies refuse to buy Russian oil. However, oil prices fell to $120.10, still 3.8% higher than Friday's closing price.
Fear and uncertainty continue to rise, pushing the Cboe Market Volatility Index (VIX) up over 11%. Fears are so high that initial public offerings (IPOs) are disappearing. January saw a record 22 cancellations. There is currently no IPO on the Nasdaq IPO calendar for any US exchange in March and in the future.
Oil was not the only petroleum product that surged. RBOB gasoline futures rose more than 10% over the weekend but shed most of their gains to close up just 1.17% on the day. Heating oil futures closed up 4.82% despite rising almost 13% late Sunday.
Why is it important? All these factors lead to stagflation. The International Monetary Fund warned that the effects of the war, including higher food and energy prices, could cripple the global economy going forward. And it’s not the only one: JPMorgan’s economists just cut their outlook for global economic growth this year by 1%, while some analysts have expressed concern that America’s ban might tip us into stagflation, which is the extreme mixture of slowing growth and rising inflation.
Benefits for traders
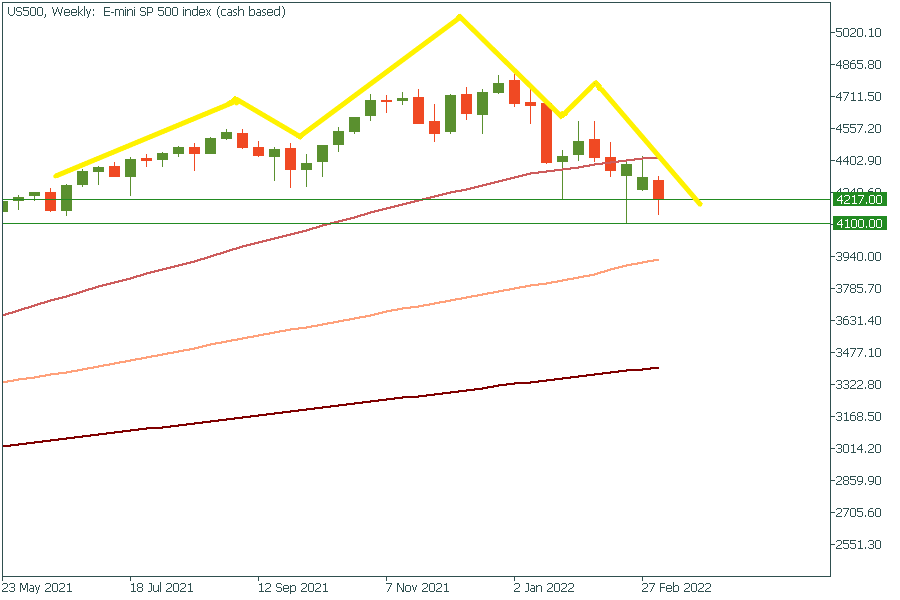
However, these events have a positive side effect. Political instability causes market fluctuations, and it’s a great chance to trade. So, recent S&P analysis have caused mild “head and shoulders” movements and now it’s on the breakout point of right shoulder at 4217.00. We can expect that most likely, the chart will reverse down to 3600.

The Head and Shoulders pattern is a useful technical analysis tool for measuring and evaluating the minimum possible degree of subsequent price movement from the neckline. It can also indicate a trend reversal when the market goes from bullish to bearish or vice versa. This pattern is considered one of the most reliable patterns that predict a trend reversal. The key to trading the Head and Shoulders pattern is to be patient and wait for the pattern to be confirmed, and false exits can sometimes occur. Don't forget to set stop loss orders.