Technical Analysis
USDCAD, H2

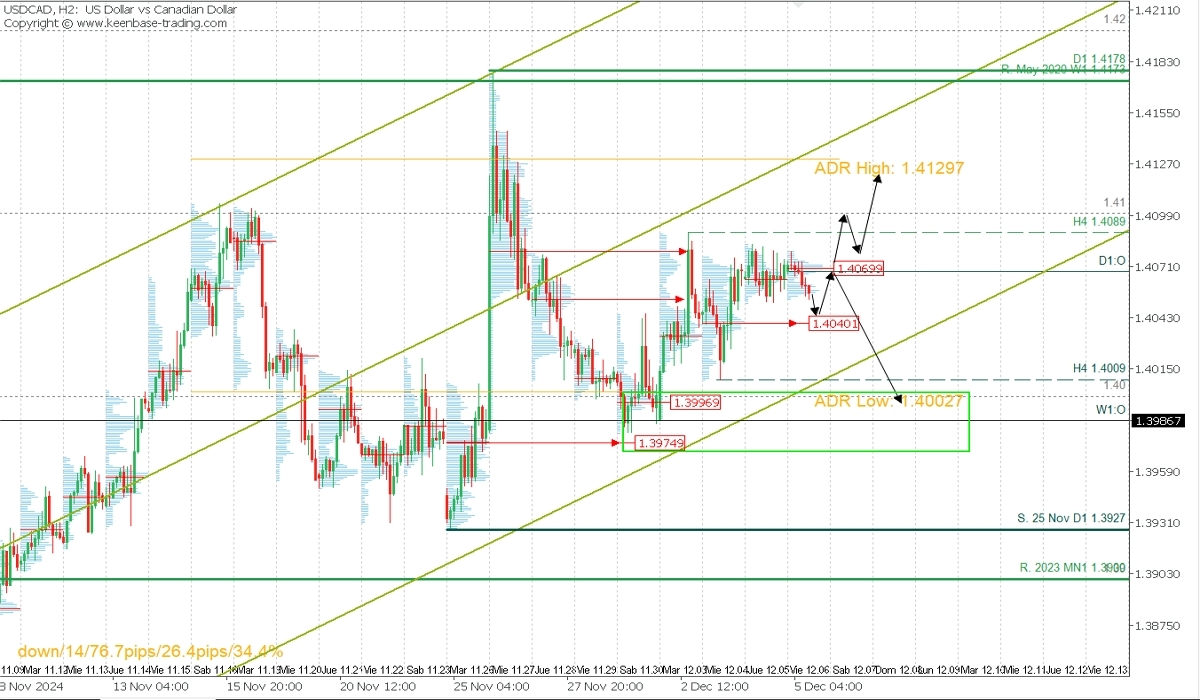
Supply Zones (Sellers): 1.4070, 1.4130, and 1.4180
Demand Zones (Buyers): 1.4040, 1.3997, and 1.3975
The pair continues trading within a daily macro ascending linear regression channel drawn from the bullish reversal on September 25 to the present day. It corrected lower after reaching the macro resistance from May 2020. The last validated support of the bullish trend is at 1.3927, which implies the trend remains intact as long as this level is not broken.
The bullish continuation shows weakness not only in structure but also due to the current position of the price in the lower side of the linear regression channel (LRC). Even so, further bullish continuation is expected after the price drops toward yesterday’s uncovered POC* (buying zone), with a potential rebound above the 1.4089 resistance. This move could pave the way for continued buying toward the daily bullish range at 1.4129 and extend upward toward the macro resistance at 1.4178 in the coming days.
On the other hand, the pair could weaken if the price decisively breaks below the 1.4040 buying zone, signaling further selling toward the 1.40 support and the next buying zone around 1.3997. This area represents a confluence of key levels that could drive the bulls back into action.
Technical Summary
Bullish Scenario: Buy after a breakout above 1.4070/1.4089 with TP at 1.4130 intraday, and targets at 1.4150, 1.4160, 1.4170, and 1.4180 in the coming days. Use an SL of 1% of your capital with low lot size to allow for movement.
Bearish Scenario: Sell after a decisive break below 1.4040, wait for a pullback to this zone, and sell with a target at 1.40, from which buying opportunities should be considered.
Always wait for the formation and confirmation of an Exhaustion/Reversal Pattern (ERP) on the M5 timeframe, as taught here: https://t.me/spanishfbs/2258, before entering any trade in the key zones indicated.
Uncovered POC:
POC = Point of Control: The level or zone where the highest concentration of volume occurred. If this area was previously followed by a bearish movement, it is considered a selling zone and forms resistance. Conversely, if it preceded a bullish move, it is considered a buying zone, typically located at lows, thus forming support areas.
