June 12, 2025
Strategy
Bar Analysis: Two Easy Entries
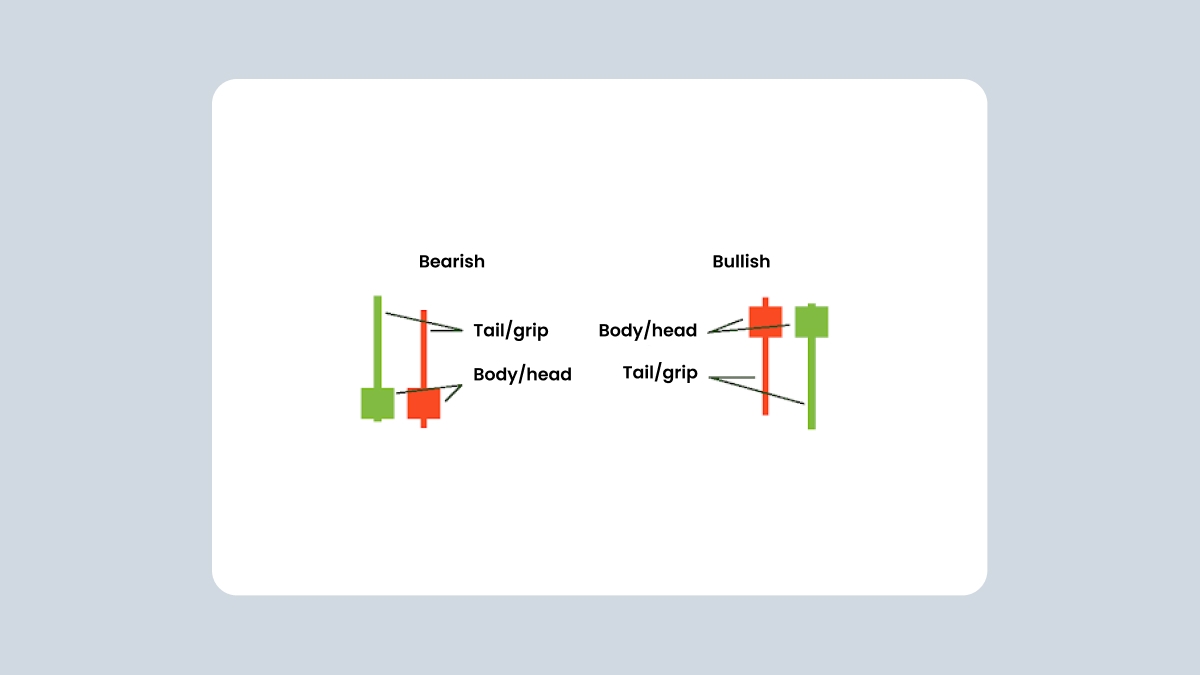
A pin bar is a typical hammer candlestick. It has a body (hammer head) and a tail (hammer grip). Its color doesn’t matter – it’s composition does, as it defines whether it comes as a bullish or a bearish signal.
If the body is in the upper part of the candlestick, it’s a bullish sign, and a precursor of an upward reversal if there was a downtrend.
If the body is in the lower part of the candlestick, it’s a bearish sign, and it often precedes a downward reversal if there was an uptrend.

Entry
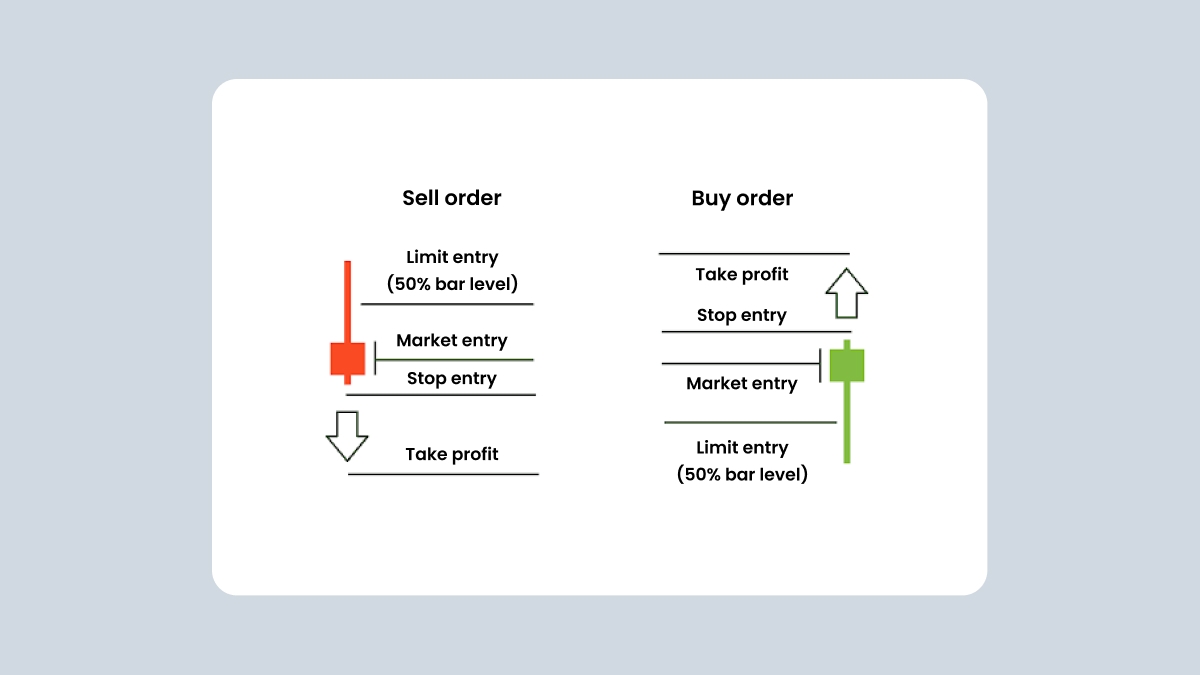
There are three easy ways to enter the market using the pin bar/hammer.
Market entry. You open your position at the current price at a level that falls inside of the candle body/hammer head.
Limit entry. You place a limit order at a level that would be approximately 50% of the candle’s tail/hammer grip.
Stop entry. You put a sell/buy stop order just below/above the tip of the candlestick.
The image below shows where levels have to be located for each entry type.
Important: make sure the pin bar/hammer is completed before you enter the market.

Inside bar
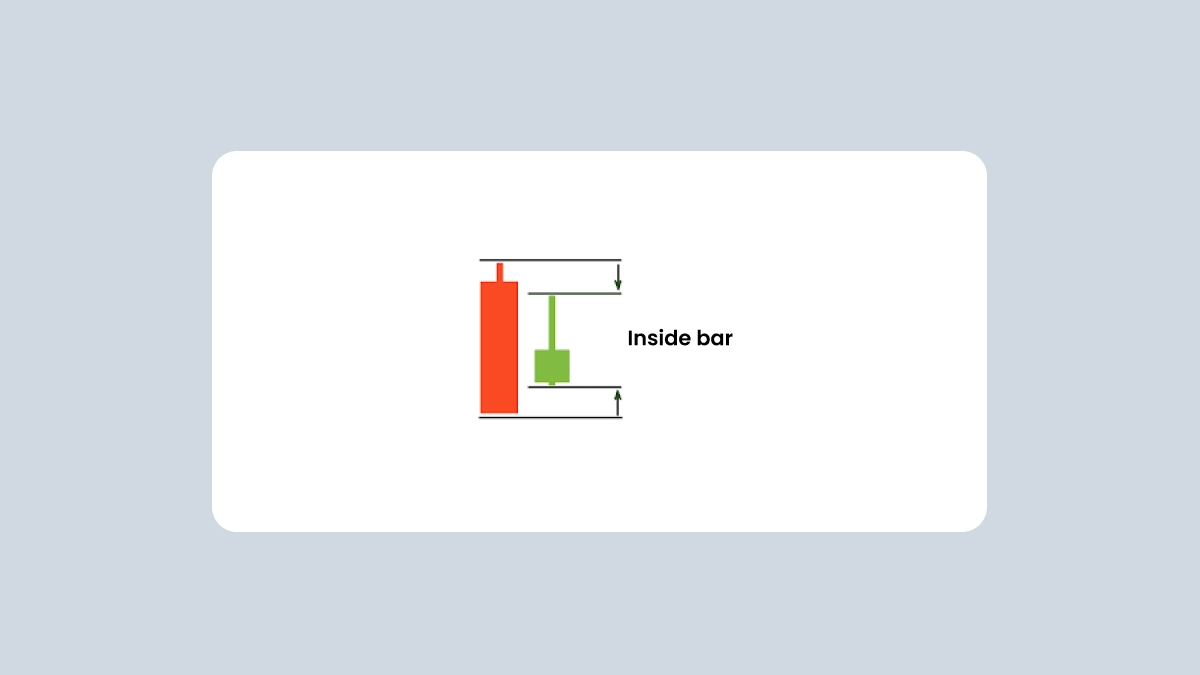
An inside bar refers to a two-candlestick formation when the body and the shadow of one bar are entirely within the limits of another bar. See the image below: the second bar is completely overshadowed by the first one.

Entry
Ideally, you will find an inside bar either below the tactical support level (bearish case) or above the resistance level (bullish case). Both scenarios indicate that the inside bar formation confirms the level being broken, so it makes sense to open a position.
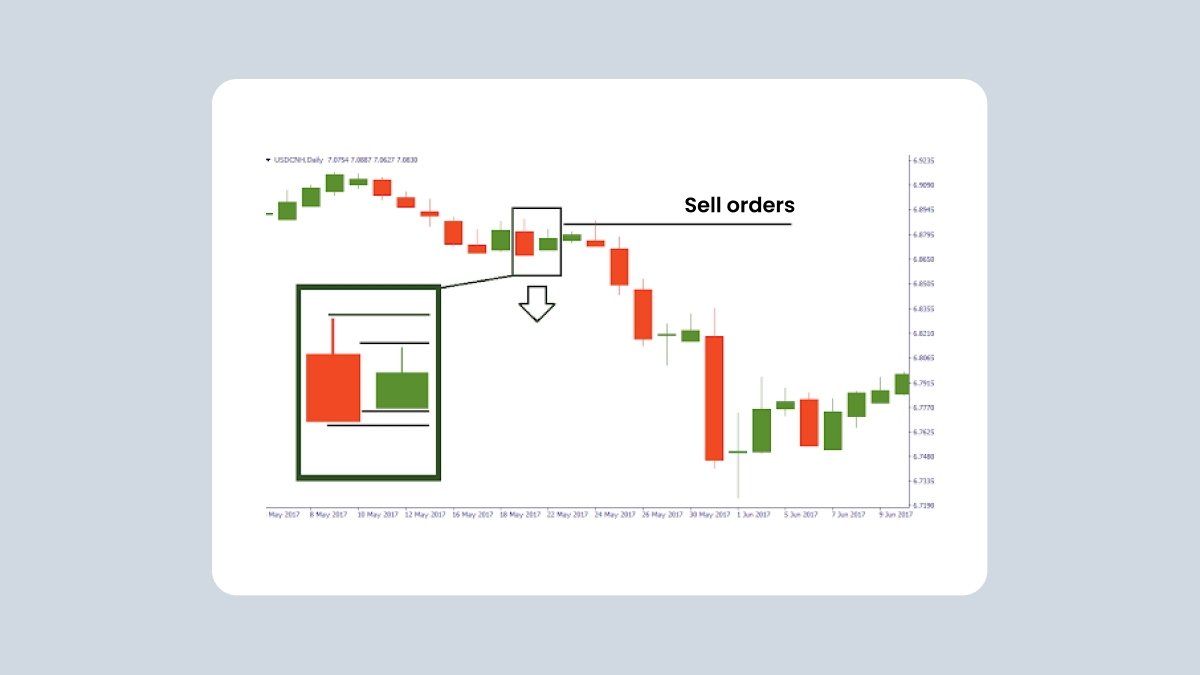
In the example below, you see that the trend was sluggishly moving somewhat downwards. But after the inside bar, it went straight downwards. In this scenario, you would open a sell order after the completion of the inside bar formation at any level within the first bar’s limits.

To learn more about candlestick patterns and how to use them in your daily trading, check out the course on candlestick analysis: