What is standard deviation in trading?
The standard deviation indicator is a statistical measure of market volatility. It measures price deviations from the moving average. If prices are trading in a narrow trading range, the standard deviation indicator returns a low value, indicating low volatility. Conversely, if prices fluctuate sharply up and down, the standard deviation returns a high value, indicating high volatility.
The standard deviation indicator in MT5
The standard deviation indicator is one of the default indicators in MetaTrader. To find the indicator, go to Insert, choose Indicators, and then Trend.
How to calculate the standard deviation
To calculate the standard deviation:
-
Calculate the average of all data points by adding all data points and dividing them by the number of data points.
-
Calculate the variance for each data point. The variance for each data point is calculated by subtracting the mean from the value of the data point.
-
Square the variance of each data point (from step 2).
-
Sum of squared variance values (from step 3).
-
Divide the sum of squares of the variance values (from step 4) by the number of data points in the data set minus 1.
-
Take the square root of the quotient (from step 5).
Fortunately, MetaTrader does all these calculations for you. You only need to understand the principle of the indicator and interpret its values.
Uses of the standard deviation
Standard deviation can be used for three purposes.
-
It’s used to identify outliers. Outliers are anomalies or deviations in a set of data that represent situations in which good trading opportunities can arise. Identifying outliers can be especially helpful for scalpers and traders who use advanced trading strategies.
-
The indicator is used to choose the right entry moment based on trends. The standard deviation helps to understand whether the current prices have deviated enough from the average and can therefore return to their average value.
-
The standard deviation is used to set an entry point based on outliers when prices point to a narrow trading range, and a sudden strong standard deviation pushes them away from the mean.
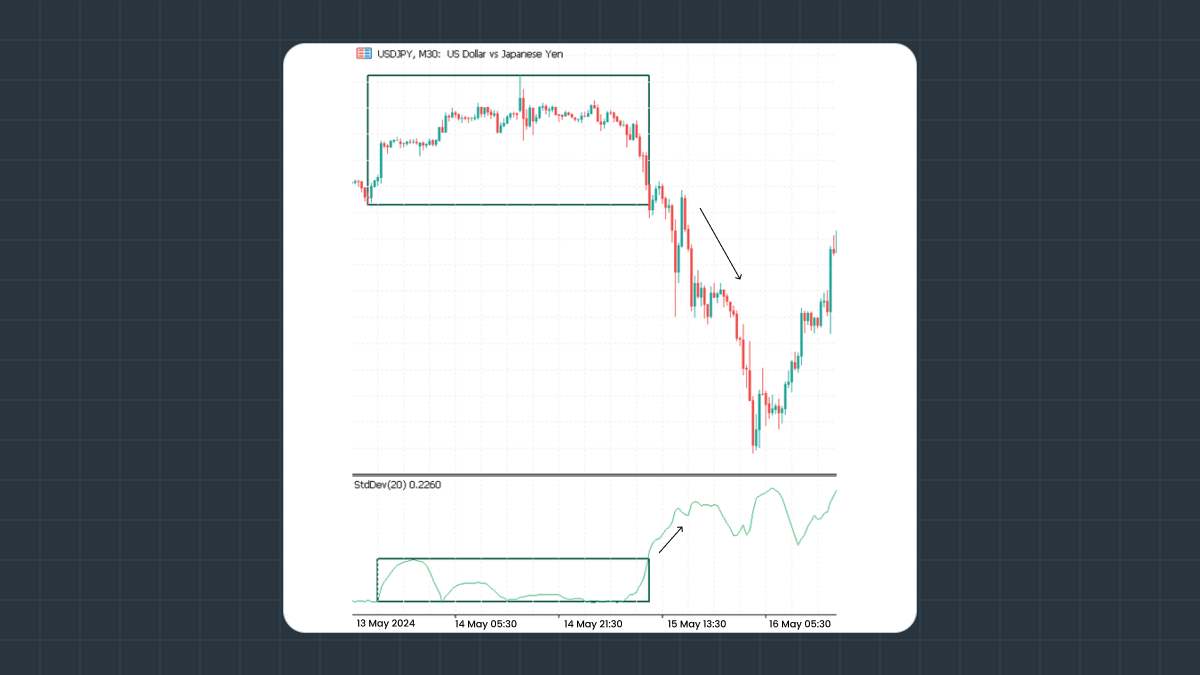
For example, you might get the “escape from the range” signal. This signal appears after the quotes leave the range – the correction area before the start of a new movement. Before the price exceeds the range, the indicator line should be at its lows, and you can draw a horizontal level through its nearest highs in the window. When the price goes out of the range, the standard deviation line also breaks up its level, confirming the entry signal. The hourly USDJPY chart below shows:
-
The price is rising up from a flat position.
-
The line of the indicator confirms the signal rising above the level drawn through its nearest highs, and you can open a buy position.
-
A stop-loss is placed under the nearest minimum. A profit can be taken when the price reaches an important resistance level or after signs of a reversal appear.

Standard deviation vs. variance
Technically, a standard deviation is the square root of the variance. In turn, the variance is the sum of the squares of the values obtained by subtracting the mean (x) from each value in the data set, divided by the number of values in the specified set. The standard deviation measures the dispersion of returns around the average return.
In other words, the standard deviation is a measure of volatility. This is a key concept in financial risk, viewed as the likelihood that returns will be dispersed around an expected value.
Pros and cons of the standard deviation indicator
The standard deviation indicator has its own pros and cons. Let’s look at them more closely.
Pros
The standard deviation indicator includes all observations. Other deviation measurements, such as range, only measure the most scattered points without considering intermediate points. Therefore, the standard deviation is often considered a more reliable and accurate measurement than other observations.
Besides, the standard deviations of two data sets can be combined using a special combined standard deviation formula. There are no similar formulas for other measurements of dispersion observation in statistics. In addition, the standard deviation can be used in further algebraic calculations, unlike other means of observation.
Cons
The standard deviation doesn’t measure how far a data point is from the mean. Instead, it compares the square of the subtle but noticeable difference in the actual variance with the mean.
Additionally, outliers have a stronger effect on the standard deviation. This is especially true when you consider that the difference with the mean is squared, resulting in an even higher number compared to other data points. So remember that the standard deviation naturally gives more weight to extreme values.
How to interpret the standard deviation indicator
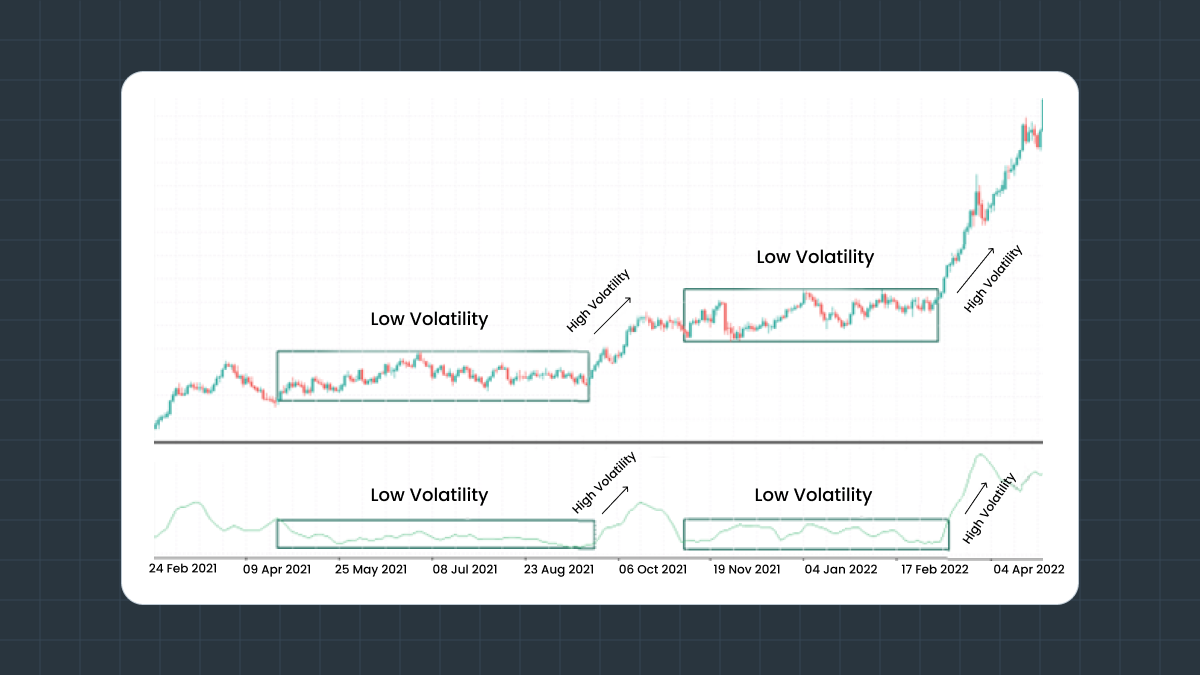
The SD indicator shows the scale of price changes relating to the moving average. If the indicator value increases, the market is volatile, and the price swings are dispersed relative to the moving average. Vice versa, if the indicator value is small, market volatility is low, and the price stays close to the moving average.
Traders need to know that periods of market activity and calm usually alternate with each other, with the price tending to return to the average level every time:
-
A rising standard deviation line means high volatility, as it reflects that the closing price and the average closing price differ significantly. Extreme standard deviation highs warn that the current activity will soon calm down and be followed by a period of consolidation.
-
A falling standard deviation line means low volatility and indicates that the market is inactive as prices are stable. Extreme standard deviation lows may signal upcoming market movement.

In addition, the current value of the standard deviation can be used to estimate the significance of a price movement. A movement greater than one standard deviation would show above-average strength or weakness of the market, depending on the movement’s direction.
Finally, the standard deviation indicator is often used as a part of other more sophisticated indicators, such as the Bollinger bands. These bands are set two standard deviations above and below a moving average.
Summary
Overall, the standard deviation indicator can help you:
-
Pick important market tops or bottoms.
-
Target entries within trends.
-
Trade with the break if prices are trading in a narrow range and a suddenly high standard deviation pushes prices away from the mean.
The standard deviation indicator is very easy to understand. It shows whether volatility is high or low and helps you enter the market at the right time.