What Does the CPI Have in Store?
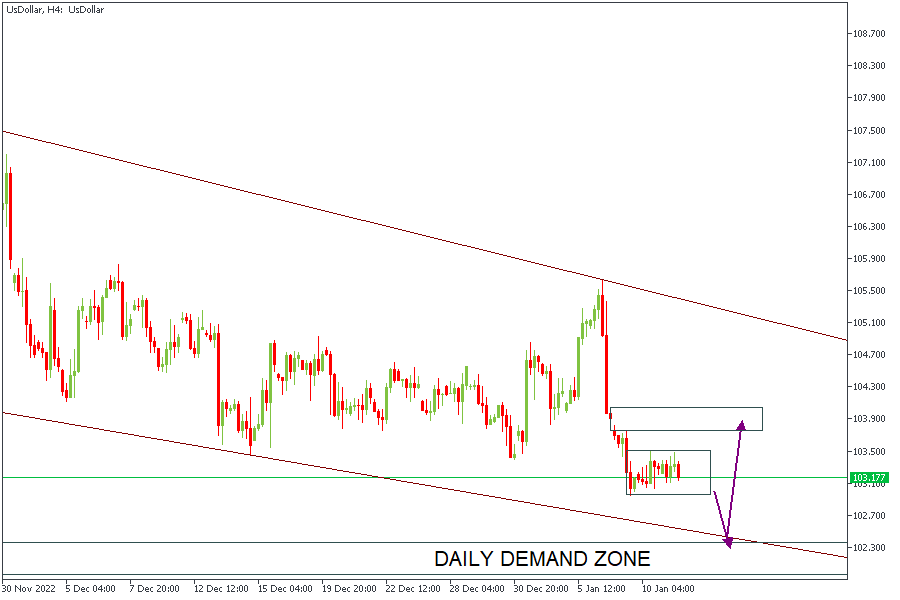
On January 12, the Bureau of Statistics will publish the figures for the Consumer Price Index (CPI), a key index for determining interest rates. While we await the release, experts forecast a decline in the CPI data, a hint at weaker Dollar values in the global markets. According to the analysts' expectations, the CPI m/m will decline from 0.1% to -0.1%, whereas the CPI y/y is expected to fall to 6.5% against the 7.1% in November. However, Core CPI is expected to rise by 0.1% from the 0.2% previous result.
With this in mind, it would be crucial to evaluate the current inclinations of the markets from a technical point of view ahead of these releases.
USDCAD
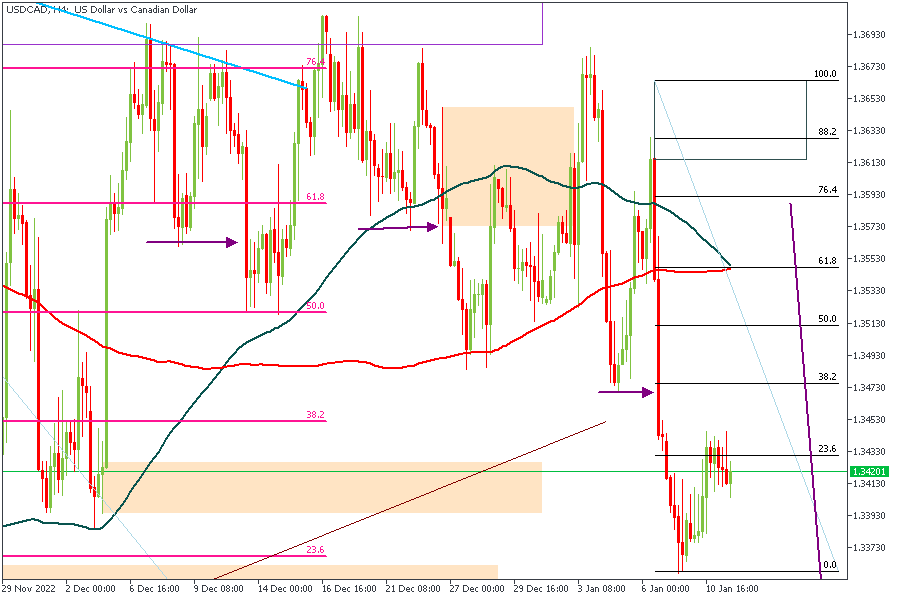
Based on the US Dollar index chart's current ranging behavior despite an overall bearish outlook. With a bullish correction, I expect the price to seize the opportunity to complete a much more robust retracement into my Fibonacci kill zone. Afterward, we could see the price decline further below the recent low.
The Fibonacci retracement levels, Moving Averages, and a rally-base-drop supply zone are added confirmations for this bias.
EURUSD
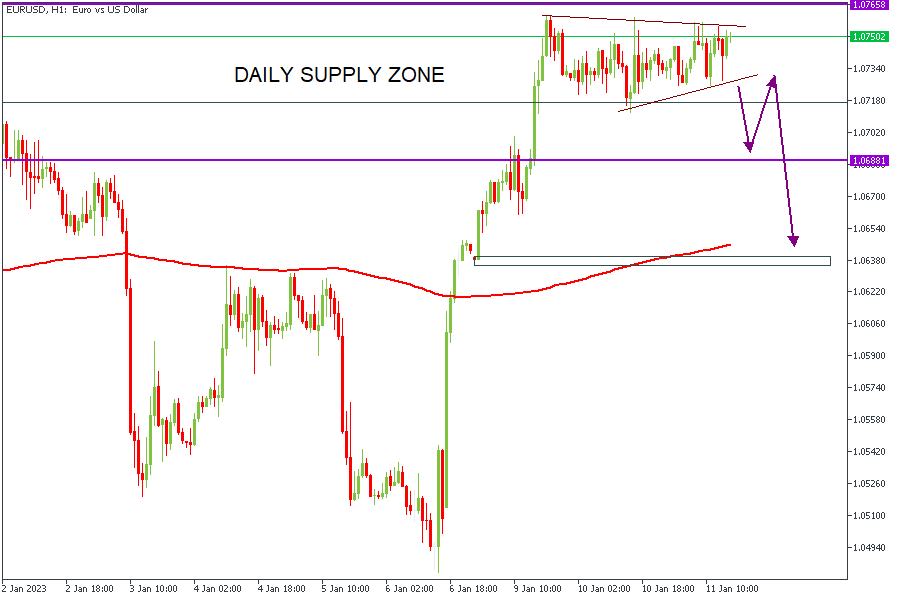
EURUSD is currently trading within a supply zone on the Daily timeframe. However, it is consolidating within a wedge. If the actual CPI release follows the expected figures, the USD will weaken. I plan to take buy entries off the 200-SMA on the hourly timeframe.
The 200-SMA, pivot zone, and rally-base-rally demand zone are my confluences.
GBPUSD
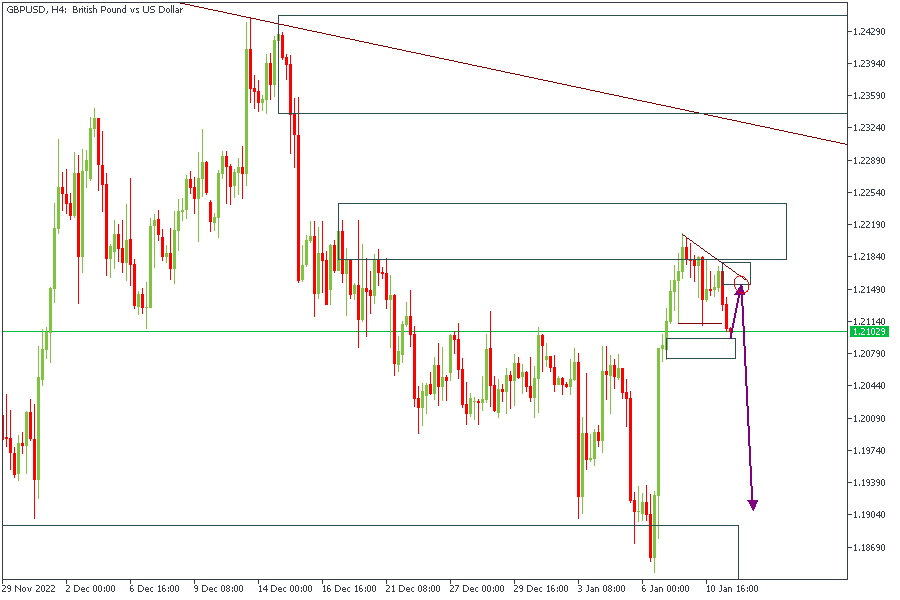
GBPUSD may experience some initial decline as a correction of the recent bullish structure break. It would mean we likely see GBPUSD slide to the 76.4% bullish impulse, an added confirmation to the demand zone.
USDJPY
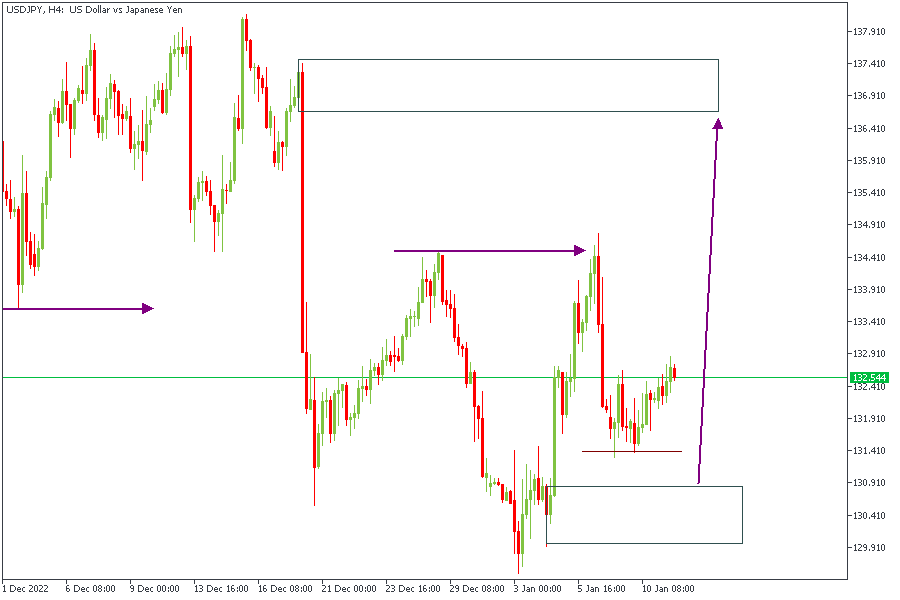
USDJPY has had an overall bearish outlook for over a week now. However, I am still waiting for the price to tap into the supply zone I marked at the top of the chart. For the price to get there, though, there should be an initial bullish correction to create a conducive retracement before the drop.
The rally-base-drop supply zone, equal-high liquidity grab, and Fibonacci kill zone are my major confluences for this trade.
XAUUSD (GOLD)
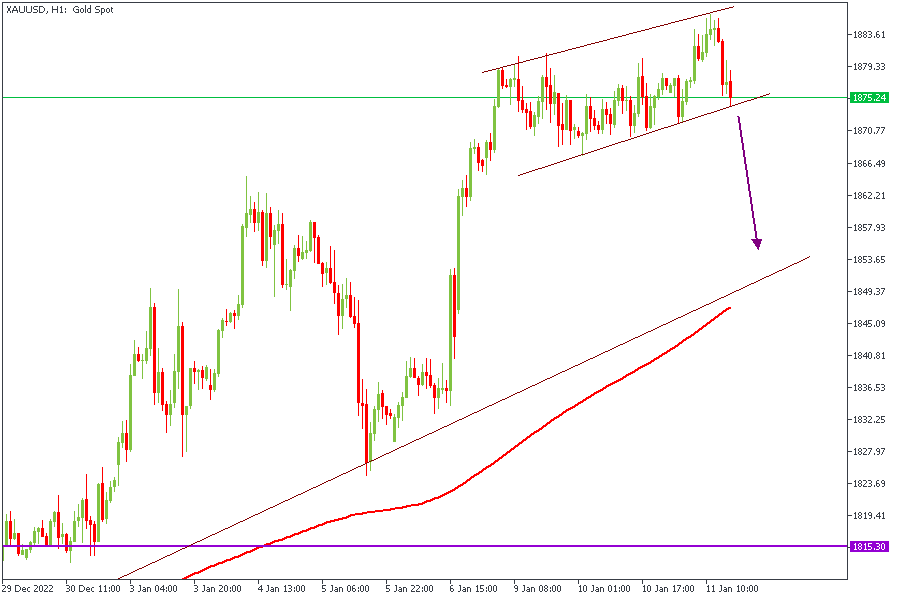
It will likely be the primary focus of many traders during the fundamental release. My chips favor the price reaching down to the 200-SMA + trendline support, as shown on the chart.
The bullish break of structure, rally-base-rally demand zone, and the Fibonacci 200-SMA are my confluences for this trade.
CONCLUSION
The views above are solely based on technical Analysis techniques using my Smart Money approach. Hence, it is essential to understand that the trading of CFDs comes at a risk. If properly managed, you may retain all of your trading capital. To avoid costly mistakes while you look to trade these opportunities, be sure to do your due diligence and manage your risk appropriately. You can access more of such trade ideas and prompt market updates on the telegram channel.