USD/JPY looking to complete correction
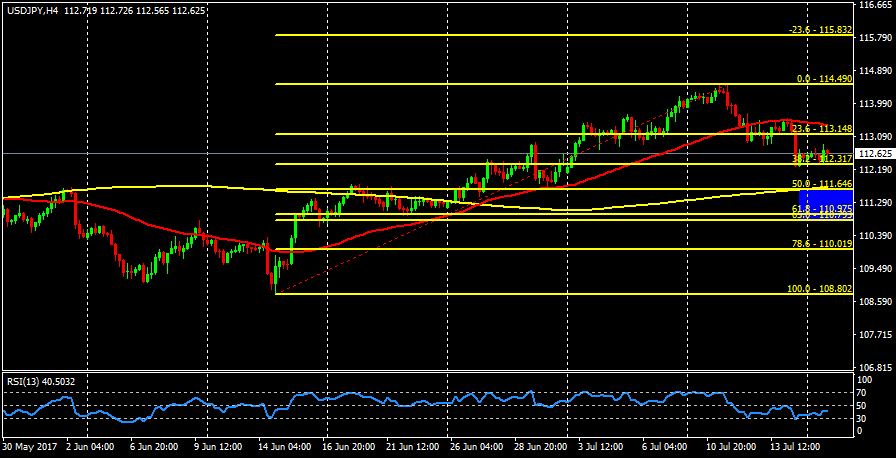
USD/JPY has been under pressure and still looks to complete the bearish correction that’s being held since last week. It can complete such move between the 111.64 and 110.79 level, which coincides with the 200 SMA at H4 chart and the Fibonacci levels of 50% and 61.8%. That area creates a demand zone where buyers could take advantage and take the pair to test the -23.6% Fibonacci retracement level around 115.83.
RSI indicator still supports the bearish corrective move, as it’s hovering around the negative territory.
