Gold Technical Indicators Suggests a Retracement Ahead
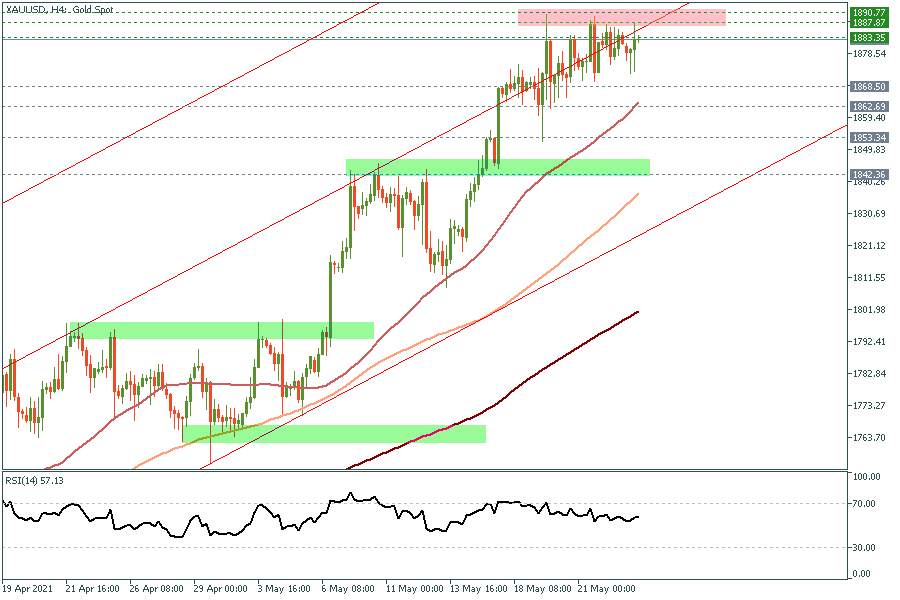
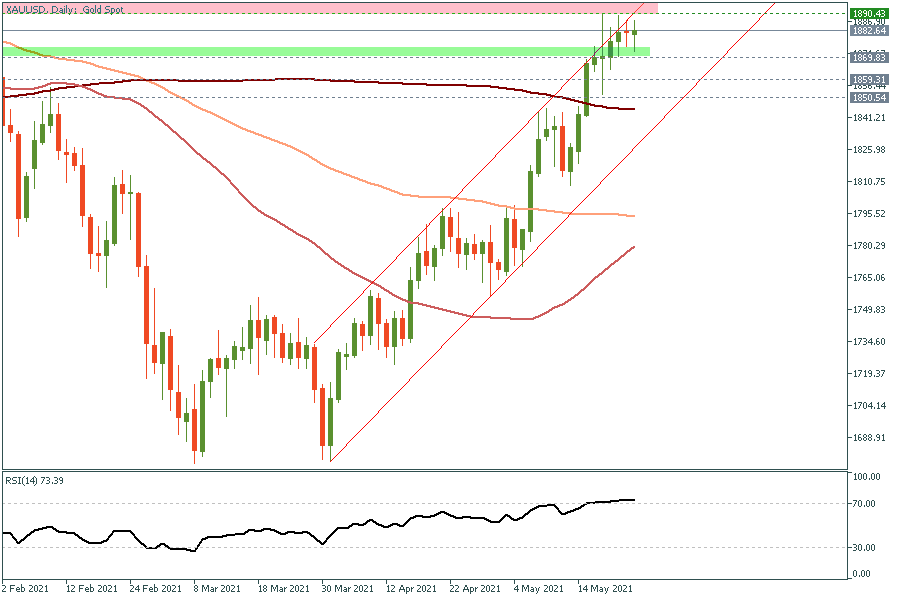
Gold has been trading within a tight range since the beginning of last week, trading between $1865 and $1890 with no clear break above or below those levels. Such tight should not be a surprise after few weeks of consecutive gains, leading the RSI indicator to enter the “overbought” territory, leading the upside momentum to ease significantly. In the meantime, another downside retracement is highly possible to retest the broken downtrend line on the daily chart, which stands around $1850 before looking into any new long positions, while any upside move, for now, is likely to remain capped below $1900 USD/Oz.
H4 chart

Daily chart

| S3 | S2 | S1 | Pivot | R1 | R2 | R3 |
| 1857.47 | 1869.29 | 1875.16 | 1881.11 | 1886.98 | 1892.93 | 1904.75 |