GBP/CAD: Will a bearish wave hit soon?
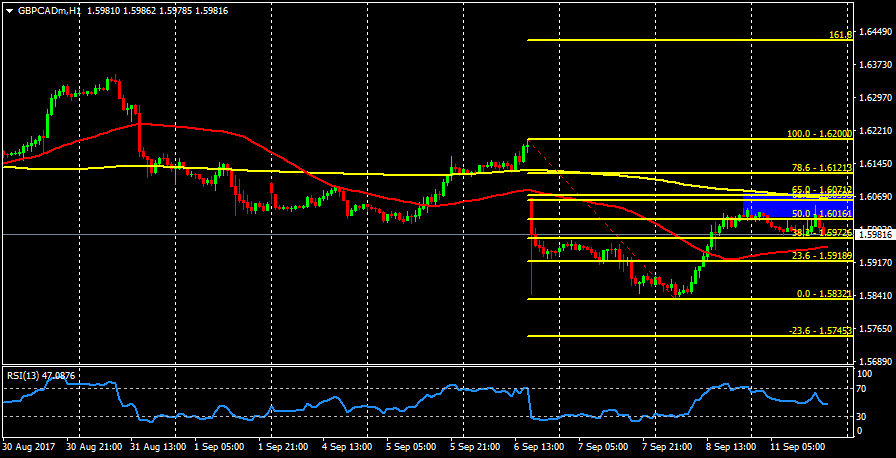
GBP/CAD still hovers below the 200 SMA at H1 chart and looks like it can resume the bearish bias soon, as the pair is currently finding resistance in the supply zone established by the Fibonacci retracement levels of 50% and 65% at 1.6016 and 1.6071 respectively. If that happens, we can expect another leg lower to reach the next target around the 1.5745 level, at which is located the -23.6% Fibo zone.
To invalidate such scenario, we need to see a break above September 11th highs in order to test September 6th highs at 1.6200.
