The hammer candlestick is the most important tool a technical analyst and/or trader has at their disposal. It is a one-bar formation that is very effective in predicting probable reversals in the market. Among candlestick formations, the hammer is one of the most visible, and it gives critical insights into the psychology of participants that impact a given asset.
The hammer formation reflects that sellers had succeeded in pushing the price of an asset lower, but buyers took over and brought it back to near the opening price.
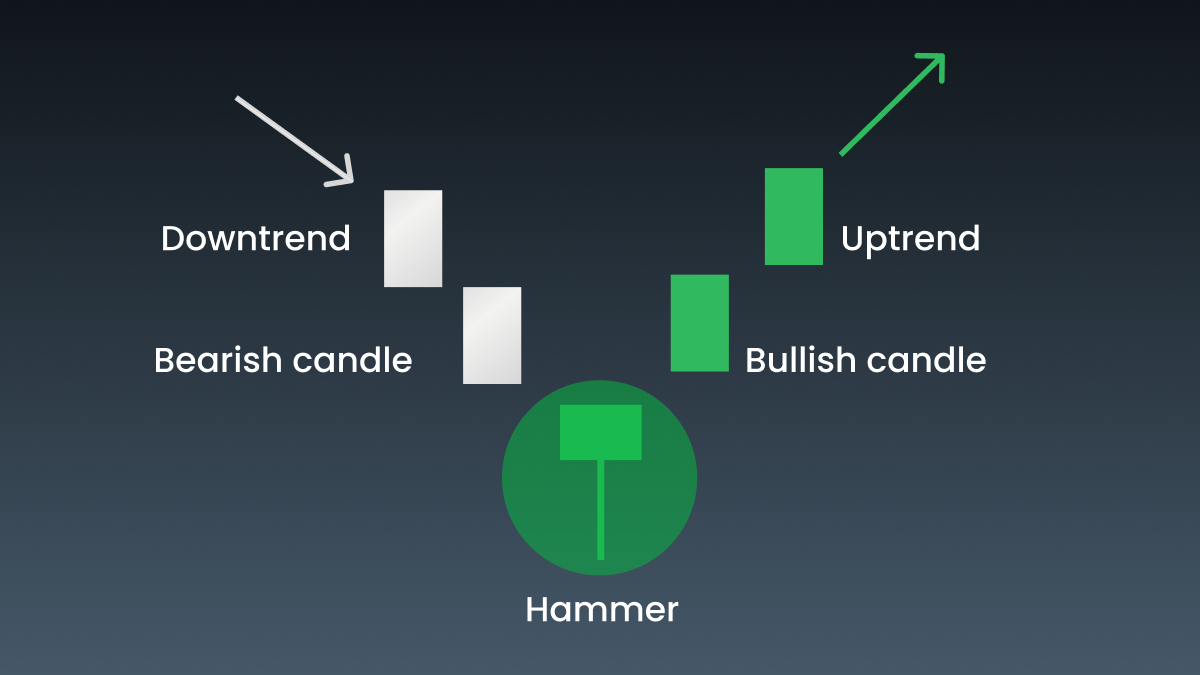
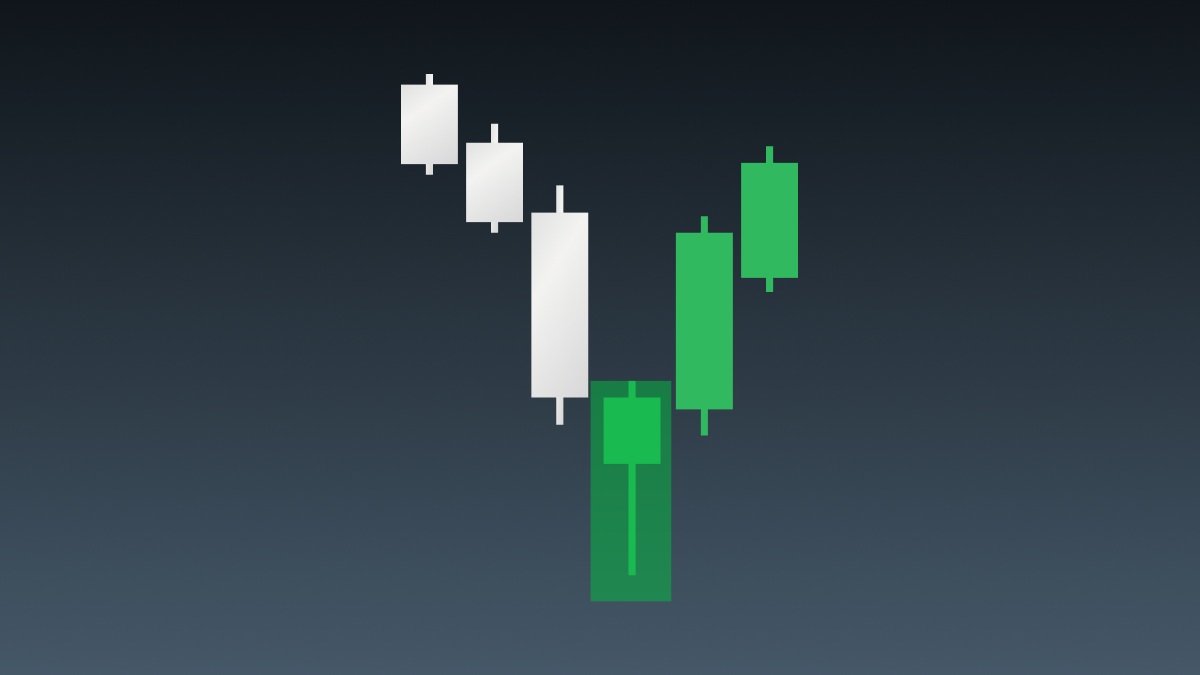
This candlestick appears during downtrends and signals that the trend might be over and about to reverse. The hammer has a small body near the top of the candle and a long lower shadow, representing that sellers initially pushed the price down, but buyers managed to regain control and brought the price back up to near the opening level.
This formation is notable in both hammer bullish and hammer bearish scenarios. When a hammer candle is bullish, it can indicate that buyers are strong enough to reverse the downtrend, potentially marking the beginning of an upward movement. Conversely, a bearish hammer, though less common, may signal a weakening uptrend and a potential downward shift.
What is a hammer candlestick?
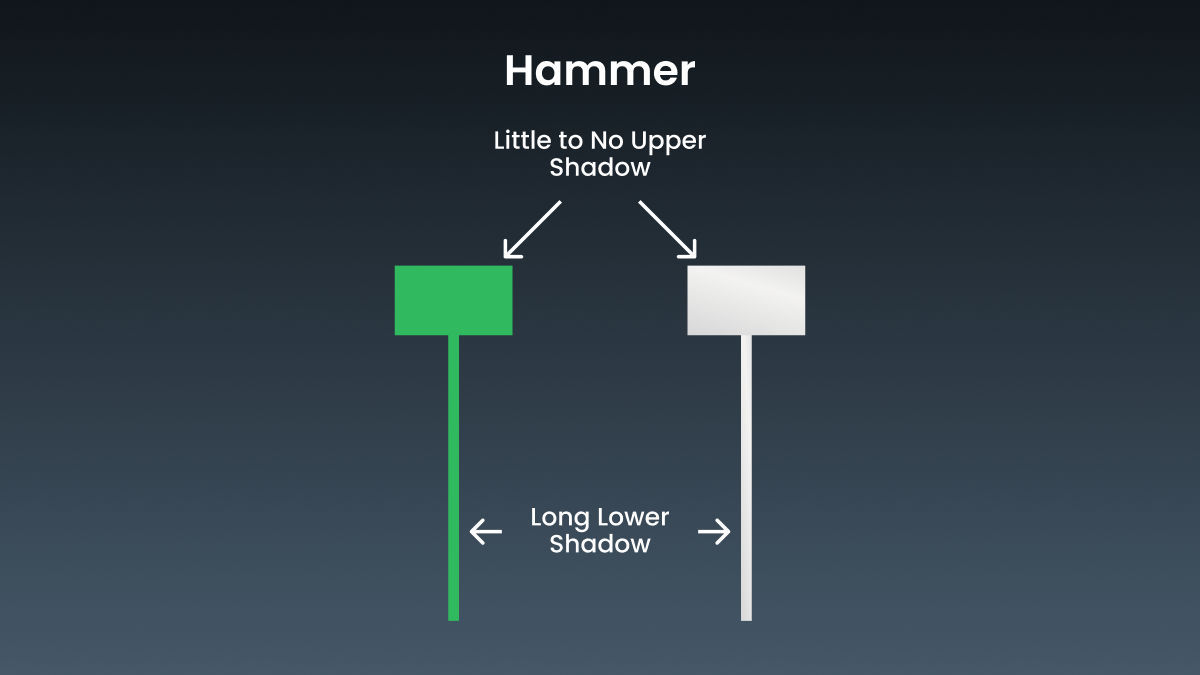
The hammer candlestick is a one-candle price chart pattern and a widely used tool in technical analysis. This candlestick reversal pattern appears after a sustained downtrend, signaling a potential change in market direction. The hammer candle meaning reflects market sentiment, where strong selling pressure pushes prices lower during the session, but buyers ultimately drive the price back up near its opening level. On a chart, a lengthy lower shadow will culminate in a distinctive small-bodied candle at the top. The resulting shape resembles a hammer, which explains its name.
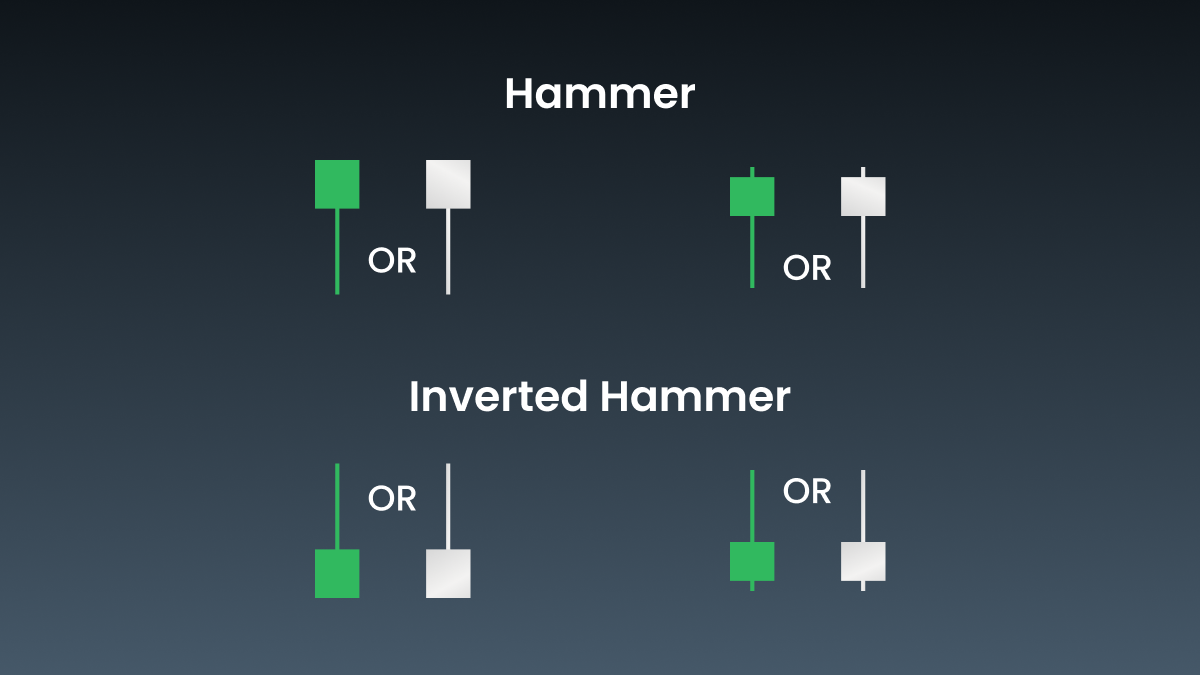
The hammer candlestick pattern can appear as either bullish (green or white), or bearish (red or black), but a bullish body is typically seen as a stronger reversal signal. This model reflects market psychology: it shows that although sellers have dragged the price down, buyers may be able to gather enough energy to push it all the way back up. In other words, it presumes a change of market sentiment from bearish to bullish.
Ready to catch the market at its turning point? Use the hammer candlestick to spot potential reversals before they unfold.
Trade nowBody of a hammer candlestick
The body of a hammer candlestick is the small, central part representing the trading period’s opening and closing prices. In a hammer candlestick, the body is located near the top, showing that the opening and closing prices were close together. This small body is essential to the pattern because it suggests that while the price dropped significantly during the period, buyers managed to bring it back up by the close.
Shadow of a hammer candlestick
The shadow of a hammer candlestick refers to the thin lines that come from the body, representing the high and low prices reached during the trading period. The shadow is identified as a long lower shadow and a very short and entirely non-existent upper shadow.
The lower shadow is at least twice the length of the candlestick body, reflecting the fact that sellers had initially pushed the price down significantly during the session, but strong buying pressure reversed this drop, pulling the price back up near the period’s opening level by the close. This pattern suggests buyers have suppressed seller activity, and an end to the downtrend may be imminent, followed by new upward movement.
The hammer candlestick has either a very small upper shadow or none at all, meaning the high price was close to the closing price. This suggests that, after an initial drop, buyers managed to drive the price back up toward the period’s high.
Hammer candlestick formation
A hammer candlestick formation appears in a downtrend and signals a potential reversal. Here’s how it typically forms and how you can spot it on a chart:
Downtrend: The market continues to fall, setting up lower highs and lower lows.
Price drop: Sellers push the price down even further during the trading session, reinforcing the downtrend.
Buyer response: Buyers then step in, creating enough buying pressure to drive the price back up toward the opening level.
Close near the opening: By the session’s end, the price closes near or slightly above the opening price, resulting in a small real body at the top of the candlestick and a long lower shadow.
This hammer candle pattern shows buyers regained control by the close, suggesting that the downtrend could be losing momentum.
Types of hammer candles
A classic hammer (or bullish hammer) is a standard hammer that appears after a downtrend. It has a small body near the top and a long lower shadow, at least twice the body’s size. The long shadow shows buyers regained control after sellers pushed the price down, signaling a possible bullish reversal.
The inverted hammer (or bearish hammer) also appears in a downtrend and looks like a hammer but upside down: It features a long upper shadow instead of a lower one, while its body remains small and stays at the bottom of the trading range. This pattern indicates that buyers tried to push the price higher after a large drop, hit some resistance, and created a potential reversal signal that the next price movement must be confirmed. However, an inverted hammer best identifies bullish reversals at a downtrend’s end.
Similar to the classic hammer, the red hammer candle has a small red body because the close is just below the open. Despite being red, it can still signal a bullish reversal, as it indicates that buyers have reduced the initial downtrend’s impact.
How to interpret hammer candlesticks in technical analysis
The hammer candle is a key indicator of a potential market trend reversal, and understanding both the advantages of the hammer candlestick and its disadvantages within the market context can help you use it effectively.
A hammer candle indicates that sellers initially drove down the asset’s price during the current trading session, but encountered strong buying pressure that pushed it back up. This buyer activity near the lower boundary of a downtrend may suggest an upcoming bullish reversal.
However, a hammer candle needs further validation. Many traders confirm a hammer candle by waiting for a follow-up candle to close higher than the hammer’s close. This helps confirm that the hammer candle significantly increases the likelihood of a reversal and signals that the downtrend may end and a new uptrend might start.
The context in which the hammer indicator appears is equally essential. A single hammer candle may not be reliable on its own. Still, one that forms at key support levels or in combination with other technical indicators, moving averages, or trend lines, amounts to a strong indicator. Understanding these other market attributes is essential for using the hammer candlestick pattern to make accurate trading decisions.
Register now to access sophisticated tools and insights that turn stock market indicators like the hammer candlestick into powerful trading decisions.
Register nowHow to trade hammer candles
The hammer candle forms the basis of various opportunities that can improve your results. By following hammer candle trading strategies and integrating risk management effectively, traders can capitalize on these patterns in a controlled way.
Identifying a hammer candle
It’s essential to focus on identifying a hammer candle formation. Thanks to its recognizable look, it is arguably one of the easiest candlestick patterns to identify.
A small body near the top of the candle with a long lower shadow that’s at least twice the length of the body, signaling rejection of lower prices.
Little to no upper shadow, emphasizing buying pressure after an initial price drop.
A bullish reversal confirmation, especially when seen at key support levels or when combined with additional indicators, like increased trading volume.
Setting stop-loss and take-profit orders to manage risk
Effective risk management is critical when trading on the hammer candlestick pattern. To integrate it, plan setting stop-loss and take-profit orders before entering the trade.
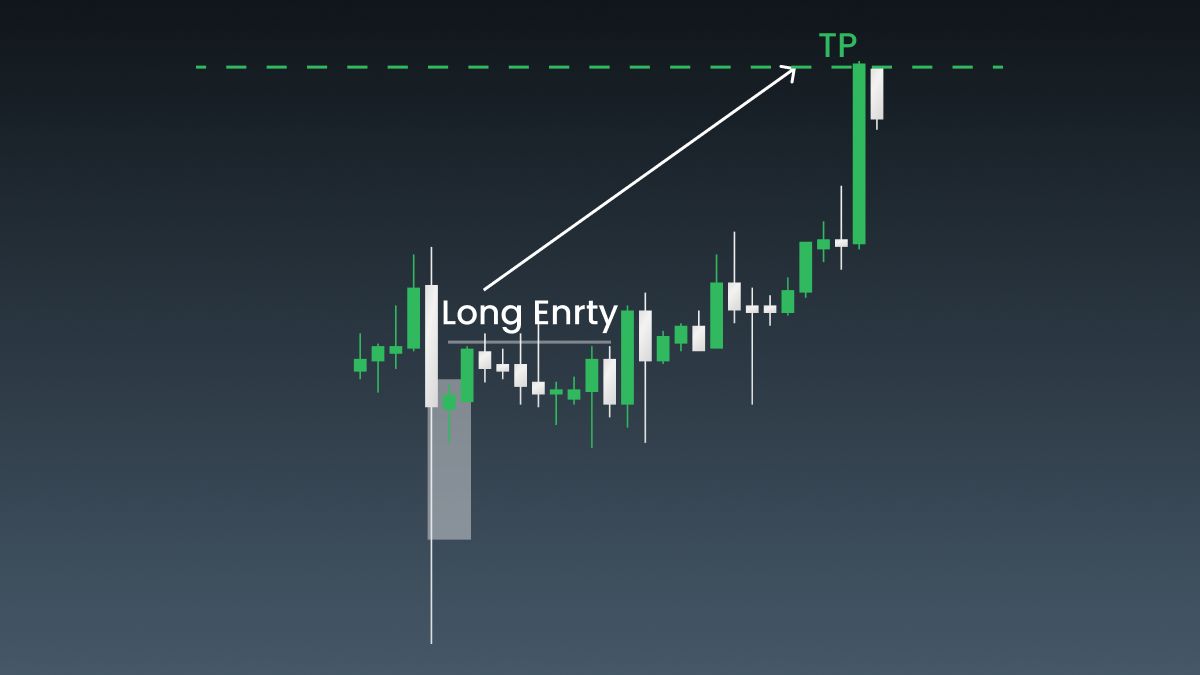
Most traders set their stop-loss just below the bottom of the hammer shadow. This will minimize losses if the market turns against the deal. Having a stop-loss at this strategic point enables the trader to save capital and provides opportunities for trading to develop.
For example, if EURUSD forms a hammer candle with at least one minimum price of 1.1000, then 1.0950 is a good place for the stop-loss. At that level, the order will limit probable losses but allow for minor market fluctuations without unduly closing the position.
Take-profit levels should align with significant resistance zones or be set according to a reward-to-risk ratio (ideally at least 2:1), maximizing gains while minimizing risk.
By structuring your trades around clear entry and exit points, using confirmation signals, and maintaining disciplined stop-loss and take-profit orders, hammer candles can provide reliable market entry points for trend reversals in trading.
Hammer candle trading strategies
Now that we have a solid understanding of the hammer candle, how to spot it, and a basic trading example under our belt, let’s dive into some practical trading strategies.
Hammer with support levels is an effective strategy that revolves around identifying key support levels where the price has previously rebounded. When a hammer pattern forms around these levels, it often signals a potential reversal. Once the price breaks above the hammer’s high, a long position can be considered, with a stop-loss placed below the hammer's low for risk management.
Combining the hammer with moving averages can also be used to confirm hammer signals. In a powerful uptrend, let the price pull back first toward a moving average, such as the 50-day line. A hammer forming in that area often presents a signal of trend resumption. A rally above the high of the hammer might trigger an entry, in which case a stop-loss should be placed below its low.
Hammer with RSI divergence is another useful tool, as the RSI allows the signals given by the hammer to be refined by identifying divergences. One would look for new price lows while the RSI is making higher lows, which indicates a bullish divergence. When a hammer appears in this scenario, this confirmation strengthens the reversal, and a long position may be opened with a stop-loss set barely below the hammer's low.
Fibonacci retracement levels are useful for defining possible reversal zones. Once a particular price move has taken place, the application of Fibonacci levels can pinpoint where the reversal might occur. If a hammer forms near a key Fibonacci level, such as 38.2% or 61.8%, it indicates a likely bounce. Entry is typically above the high of the hammer with a stop-loss under its low.
Hammer with MACD and support levels strategy will combine the hammer pattern with the moving average convergence divergence indicator and key support levels. First, identify a support zone where the price has bounced in the past. When a hammer forms near this level, specifically check the MACD for confirmation and look for a bullish crossover when the MACD line crosses above the signal line. This, in turn, confirms the reversal signal since both price action and momentum point higher. Entries could be placed above the high of the hammer, with a stop-loss below the low.
Volume confirmation with the hammer can be another good strategy to consider, as volume is an important factor when trading the hammer. A high-volume formed hammer indicates strong buying interest and a greater chance of reversal. If the hammer candle has a significantly higher volume than previous candles, this can increase confidence in entering a position above the hammer’s high, with a stop-loss placed below its low.
Trade nowAdvantages and disadvantages of hammer candles
| Advantages | Disadvantages |
Indicates reversal potential | Hammer candles can provide clear signals for potential trend reversals. This will help traders make timely entry and exit decisions in response to market changes. | If the trend continues, they can give false signals, potentially leading to losses if entered without further confirmation. |
Versatile across markets | Useful in both bullish and bearish markets, adaptable to swing and day trading strategies. | The effectiveness of hammer candles can vary depending on market context and timeframes; a hammer in a short timeframe may not hold weight in a longer one. |
Easy to identify | Even beginner traders will be able to identify the hammer candle pattern due to its recognizable shape. | Limited in detail, hammer candles alone don’t indicate reversal strength and need additional indicators. |
Profit potential | When used effectively, hammer candles can yield high reward-to-risk ratios in reversal trades. | Overtrading based on these signals can increase transaction costs and potential losses, especially if multiple trades fail. |
Combination with other patterns | Confirmation candles reduce the likelihood of false signals, allowing for more reliable entries after a hammer appears. | Waiting for confirmation can also mean missed opportunities, especially in fast-moving markets where price changes rapidly. |
Adaptable across asset classes | Hammer candles can be used across various asset classes, allowing traders to apply similar strategies in stocks, forex, and commodities. | Market differences in liquidity and volatility affect signal reliability, requiring traders to adjust strategies for each asset. |
Psychological insight | Hammer candles reflect market psychology, revealing how buyers and sellers interact, which can deepen understanding of sentiment shifts. | Focusing too much on trading psychology may, at times, lead to neglecting fundamental analysis, risking less informed decisions. |
Risk management opportunities | Hammer candles help effectively set stop-loss levels near reversal points, allowing for more precise risk management. | Relying solely on hammer candles for risk management, you might overlook other crucial factors like volatility, reducing protection against price swings. |
Confirmation requirement | Confirmation candles reduce the likelihood of false signals, allowing for more reliable entries after a hammer appears. | Waiting for confirmation can mean missed opportunities, especially in fast-moving markets where prices change rapidly. |
Adaptability to different trading styles | Hammer candles are versatile for various styles, including scalping, day, and swing trading, which makes them suitable for multiple trading strategies. | Interpretations may differ across trading styles, creating potential confusion or inconsistency among traders. |
Summary
One of the most valuable candlestick patterns traders and investors have at their command is the hammer. It generally constitutes a reliable signal that there might be a market reversal from the trend. The formation is marked with a small body and a long lower shadow, indicating that buying is overpowering selling pressure, reflecting a shift in market sentiment. Thus, this pattern used for trading strategies enables investors to decide on the best timing for their entry and exit positions to maximize returns.
The most effective way to use the hammer candle is to confirm it with the next price action or other technical indicators, always maintaining proper risk management through stop orders. Understanding the market in general and contextualizing the hammer model within a mosaic of other analytical tools will help a trader make more informed strategic decisions.
Trade nowFAQ
What is the difference between a hammer candle and an inverted hammer?
An inverted hammer is a candlestick pattern that suggests a potential trend reversal. The inverted hammer candle looks like a hammer, but upside down: it features a long upper shadow instead of a lower one, while its body remains small and stays at the bottom of the trading range. This pattern indicates that buyers tried to push the price higher after a large drop, hit some resistance, and created a potential reversal signal that must be confirmed by the next price move. However, an inverted hammer best identifies bullish reversals at a downtrend’s end.
How can I identify a hammer candle formation?
It’s essential to be able to identify a hammer candle formation. Thanks to its recognizable look, it is arguably one of the easiest candlestick patterns to identify.
A small body near the top of the candle with a long lower shadow that’s at least twice the length of the body, signaling rejection of lower prices. Little to no upper shadow, emphasizing buying pressure after an initial price drop. A bullish reversal confirmation, especially when seen at key support levels or when combined with additional indicators, like increased trading volume.
What are the best trading strategies for hammer candles?
The best strategies for trading with a hammer candle pattern revolve around confirming the reversal signal using additional indicators or levels to enhance reliability. One of the effective strategies that you can employ is as follows:
Hammer with support levels is an effective strategy that revolves around identifying key support levels where the price has previously rebounded. When a hammer pattern forms around these levels, it often signals a potential reversal. A long position can be considered once the price breaks above the hammer’s high, with a stop-loss placed below the hammer’s low for risk management.
Combining the hammer with moving averages can also be used to confirm hammer signals. In a powerful uptrend, let the price pull back first toward a moving average, such as the 50-day line. A hammer forming in that area often presents a signal of trend resumption. A rally above the high of the hammer might trigger an entry, in which case a stop-loss should be placed below its low.
Hammer with RSI divergence, as the RSI allows the signals given by the hammer to be refined by identifying divergences. One would look for new price lows while the RSI is making higher lows, which indicates a bullish divergence. When a hammer appears in this scenario, it serves as a confirmation that strengthens the reversal, and indicates that a long position may be opened with a stop-loss set barely below the hammer’s low.
You can read more about effective hammer candle strategies in the article above.
Are there specific timeframes better suited for trading hammer candles?
The hammer candle can be applied across all markets and timeframes, from intraday charts to daily and weekly charts. The indicator becomes all the more crucial when the market becomes highly volatile, and price swings become prominent. For example, in a downtrend of the EURUSD forex pair, a hammer candle may signal a reversal, pushing traders who maintain proper risk management measures to establish long positions.
The hammer pattern often appears after earnings reports or critical news events. A hammer candle may form when the stock has declined due to pessimistic sentiment, but an earnings report comes in better than expected. This could signal reverse growth, which traders can use to open a long position and wait until the stock’s price recovers.
How can I manage risk when trading with hammer candles?
Effective risk management is critical when trading on the hammer candlestick pattern. Most traders set a stop-loss just below the bottom of the hammer shadow. This will minimize losses if the market turns against the deal. Having a stop-loss at this strategic point enables the trader to save capital and provides opportunities for trading to develop.
For example, if EURUSD forms a hammer candle with at least one minimum price of 1.1000, then 1.0950 is a good place for the stop-loss. At that level, the order limits probable losses but allows for minor market fluctuations without unduly closing the position.
How different is a doji hammer dragonfly from a hammer candle?
Hammer and doji candles can signal potential reversals, but they also have key differences.
A hammer has a small body with a long lower shadow, showing a solid shift from selling to buying pressure. In contrast, a doji has a very small body with nearly equal shadows on both sides. Depending on what follows, a doji can suggest a reversal or continuation. Meanwhile, a hammer usually appears after a price drop and, if confirmed, points to a likely upward reversal, with its single, long lower shadow standing out.
The doji dragonfly and the hammer both signal potential bullish reversals at the end of downtrends, but they have different structures. The doji dragonfly has the same open and close prices, while the hammer features a small body near the top of the range, with slightly different open and close prices. For more accurate signals, both patterns should be combined with other indicators.
Open a demo account